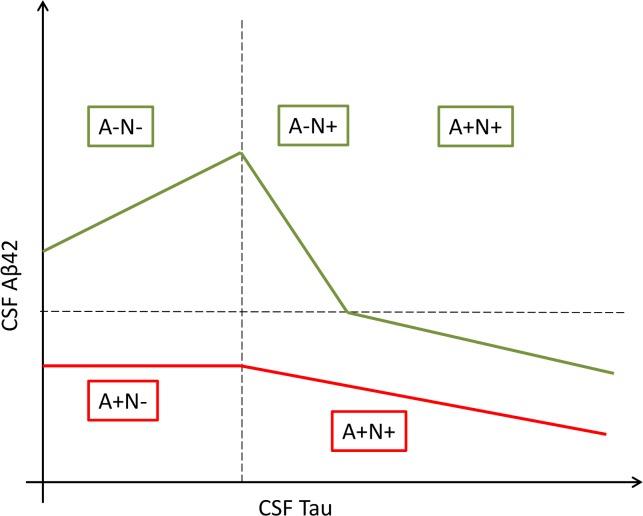
Fig 3. Two distinct patterns: Theoretical framework of the association between CSF Aβ42 and CSF Tau.
In green, patients with normal profiles have an increase of CSF Aβ42 followed by a decrease after the progression of tau pathology. In red, patients with isolated low CSF Aβ42 had a stable level before declining.

