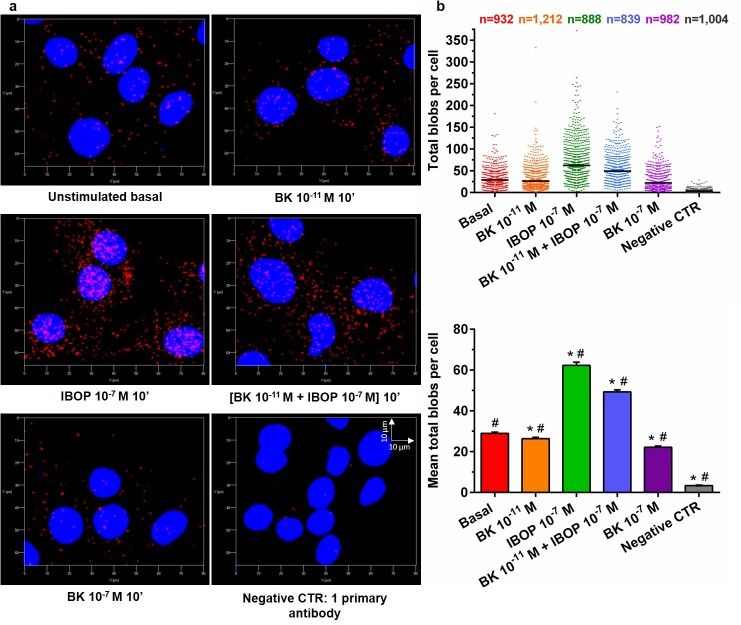
Fig 4. Quantitative analysis of B2R-TP proximity in VSMC using dual receptor PLA recognition workflow.
(a): Representative 3D images of B2R-TP PLA blobs (red) obtained for RASMC that were either kept untreated, or stimulated with BK, IBOP, or combinations for 10 min. (b): Scattergram of the total number of PLA blobs per cell for B2R-TP heteromer. The total number of cells analyzed is shown at the top of the scattergram for each treatment group. Bar graphs of the mean± SEM total B2R-TP PLA blobs per cell were also plotted. Statistical analyses were performed using Kruskal-Wallis One Way ANOVA (p ≤ 0.0001) followed by Dunn’s multiple comparison analysis. N = 3 independent experiments. (*) p < 0.05, versus basal; (#): p < 0.05, all pairwise comparisons.

