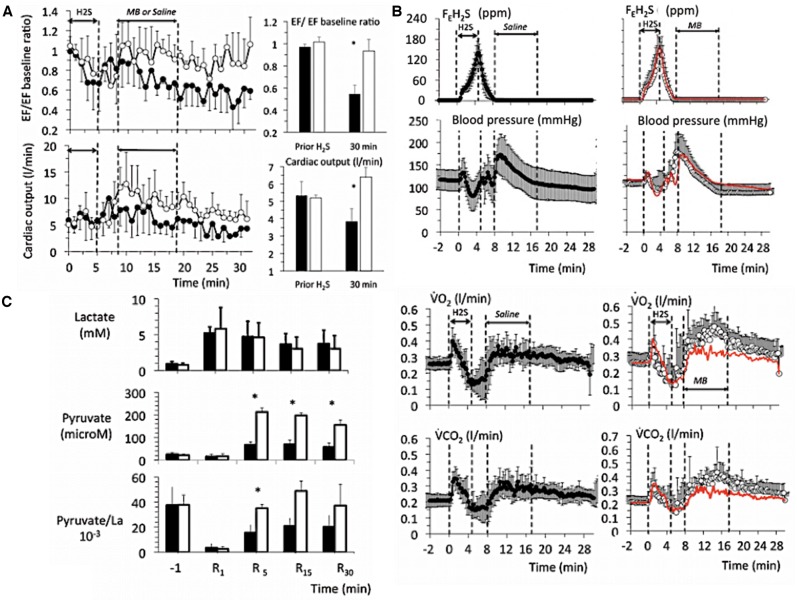
Figure 5.
Temporal profile of the changes (mean ± SD) in left ventricle ejection fraction (EF) and cardiac output (A), expired H2S, blood pressure, O2 and CO2 (B) following sulfide exposure in protocol 2 (sublethal intoxication). The closed symbols represent the untreated animals while the open symbols represent the animals treated by MB (3 min after the end of sulfide exposure) whereas the red-dotted line corresponds to the average data of the untreated animals. Note the drop in EF during H2S exposure in both groups and that in the nontreated animals, a continuous decrease in EF developed over time reaching −50% of the baseline value at 30 min along with a significant reduction in cardiac output. MB in all instance restored the cardiac function. Also note that (1) H2S in expired gas was undetectable, when MB was administered, (2) blood pressure was not different between the 2 groups of animals, reflecting a rise in peripheral vascular resistance in the non-treated sheep, and (3) O2 consumption and CO2 production increased in response to MB (see text for discussion). C, PL ratio also increased after MB and returned to baseline values. Concentrations of MB decreased form 121 μM at 1 min to 20 μM at 30 min.

