Figure 3. .
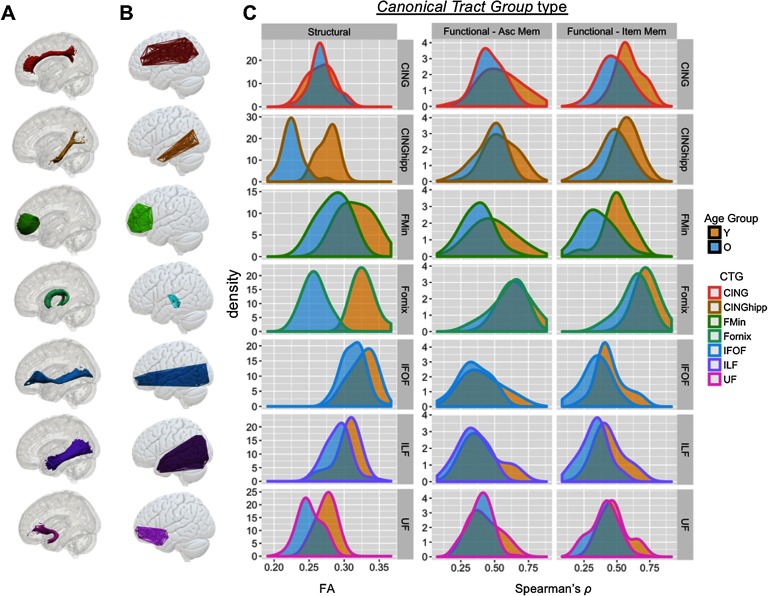
Illustration and age distributions of canonical tract groups. Column (A) describes tract ROIs from the JHU Tract Atlas (see Methods) and column (B) describes the connectome-based canonical tract groups (CTGs) formed from our algorithm, for each tract. (C) Distribution of CTG values for structural connectivity (FA) and functional connectivity (Spearman’s rho, as calculated in PPI) for source and item memory in younger and older adults. CTG values are shown for seven major CTGs that influence the final SEMs below. Age-related statistics are presented in Table 2. Cing = cingulum; CingHip = ventral leg of the cingulum; FMin = forceps minor (or genu); IFOF = inferior fronto-occipital fasciculus; ILF = inferior longitudinal fasciculus; UF = uncinate fasciculus.

