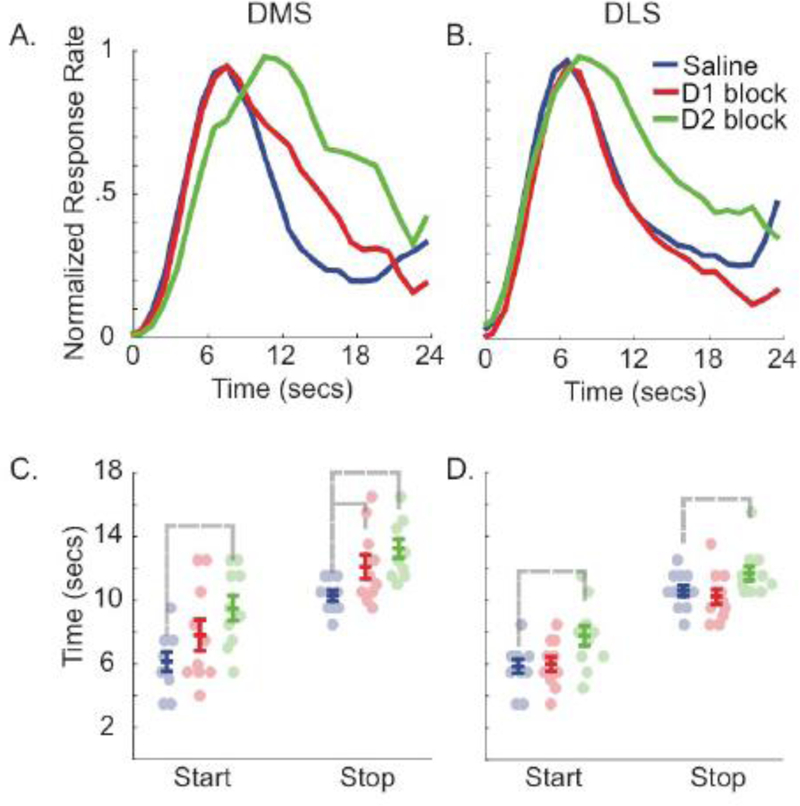
Figure 2: D2 blockade affects start and stop times, and D1 blockade affects stop times in the dorsomedial striatum.

A and B show normalized probe trial response rate during infusion sessions in the dorsomedial and dorsolateral striatum, respectively. C and D show start and stop times obtained via single-trial analysis in the dorsomedial striatum (n = 10) and dorsolateral striatum (n = 11), respectively. Circles indicate individual subject medians; colored lines show mean ± standard error for each infusion type; and gray lines indicate significant differences (p < 0.05).
