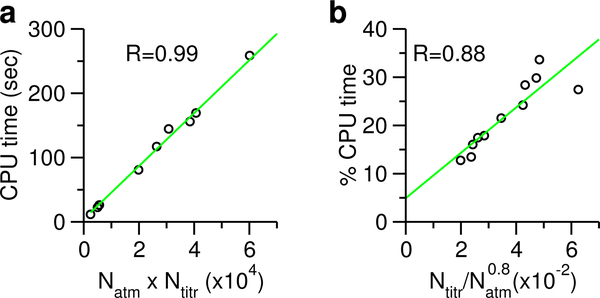
Figure 2: Timing statistics of the current GBNeck2-CpHMD implementation.
a) CPU time for CpHMD titration scales linearly as the product of number of atoms (Natm) and number of titratable sites (Ntitr). The regression line is shown in green. For clarity, the data point for BACE1 is hidden. b) Percentage CPU time for the CpHMD titration relative to the GB calculation scales approximately linearly as the ratio between Ntitr and . Timing was based on the 5-ps single pH CpHMD runs using 2 cores on a workstation.

