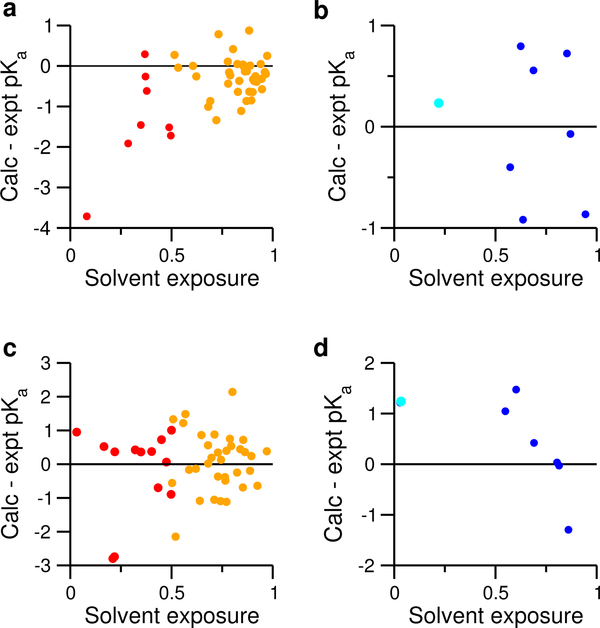
Figure 4: Correlating the pKa errors with the degree of solvent exposure.
Upper panel. pKa errors vs. fSASA for carboxylic groups (a) and histidines (b) not involved in strong electrostatic interactions. fSASA refers to the ratio between the solvent accessible surface area (SASA) of the sidechain in protein and in the model. The average fSASA over all pH conditions are used. To guide the eye, a green regression line is drawn for the data in a). The correlation coefficient R is given. For Asp/Glu, SASA includes the carboxylic group (COO) and dummy hydrogens. For His, SASA includes all imidazole ring atoms. Lower panel. pKa errors vs. fSASA for carboxylic groups (c) and histidines (d) involved in strong electrostatic interactions. In all plots, data for carboxylic groups are colored red, and those for histidines are colored blue.

