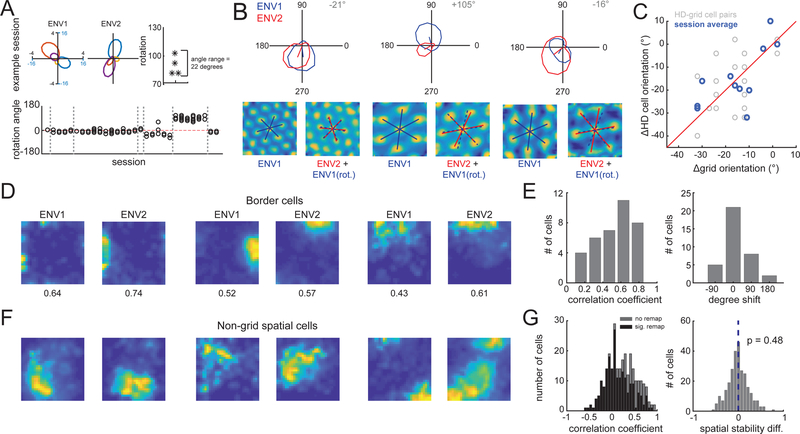
Fig. 2. Performance of a task induces remapping in head direction, border and non-grid spatial cells.
(A) Top row: Four co-recorded HD cells in each environment. Rightmost panel indicates each cell’s rotation between environments. Bottom row: rotation angles observed across sessions. Gray lines indicate boundaries between animals. (B) Co-recorded grid and HD cells. (Top) HD tuning curves. (Bottom) Grid cell autocorrelations with grid axes. Co-rotation of grid and HD signals shown by rotating the ENV1 grid axes by the rotation observed in co-recorded HD cell (blue dashed lines). (C) (Grey) HD cell orientation change (between environments) versus grid cell orientation change for all possible pairs of co-recorded HD and grid cells. (Blue) Same data, with all HD or grid cells recorded within the same session averaged together. (D) Border cell rate maps in ENV1 and ENV2. (E) Histograms of border cell rate map ENV1 versus ENV2 correlation coefficients (left) and rotation values (right). (F) Non-grid spatial cell rate maps in ENV1 and ENV2. (G) (Left) Histogram of non-grid spatial cell rate map ENV1 versus ENV2 correlation coefficients (black = cells with significant re-mapping, grey = non-significant re-mapping). (Right) Histogram of the difference in spatial stability between ENV1 and ENV2.

