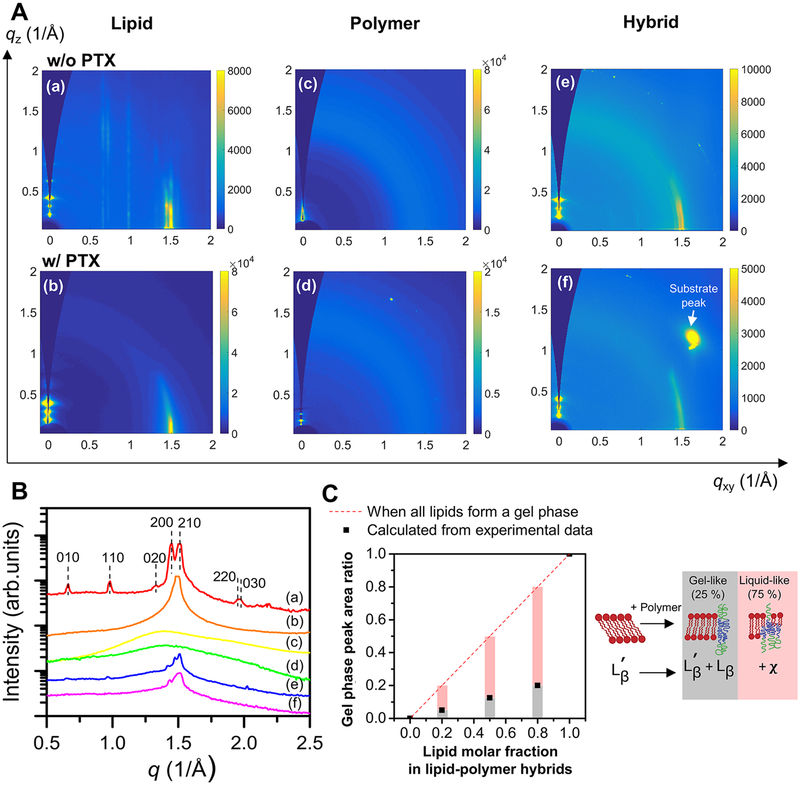
Figure 4.
(A) GIWAXS two-dimensional reciprocal space images of the films: (a) DPPC, (b) DPPC + 5 mol % PTX, (c) PBD-b-PEO, (d) PBD-b-PEO + 5 mol % PTX, (e) 4:1 molar ratio of DPPC to PBD-b-PEO hybrid, (f) 4:1 molar ratio of DPPC to PBD-b-PEO hybrid +5 mol % PTX. Note the difference between (a, e) and others; (a, e) show several rod-shaped in-plane diffraction signals, while (b, f) display a single in-plane signal and (c, d) show no in-plane diffraction. (B) GIWAXS one-dimensional I(q) profiles of (a–f) films to compare the Bragg reflections along the in-plane direction (qxy). In (a), Bragg peaks assigned to a lipid headgroup unit cell are indicated by vertical dashed lines and their associated Miller indices. (C) Left: from the GIWAXS data sets, the integrated intensity of the gel phase peak was calculated and the relative peak area ratios of hybrid films to pure DPPC films were calculated (denoted by black square points). If DPPC lipids maintain the gel phase not affected by the presence of PBDPEO, the area ratio should be proportional to the DPPC to PBDPEO molar ratio (denoted by the red dashed line), which was not the case of our systems. Right: an illustration summarizing lipid in-plane phase transitions upon polymer incorporation. When polymer is present, only ~25% of the lipids remain as gel-like phase ( and Lβ), while the other ~75% turn into more disordered, liquid-like phase (χ).

