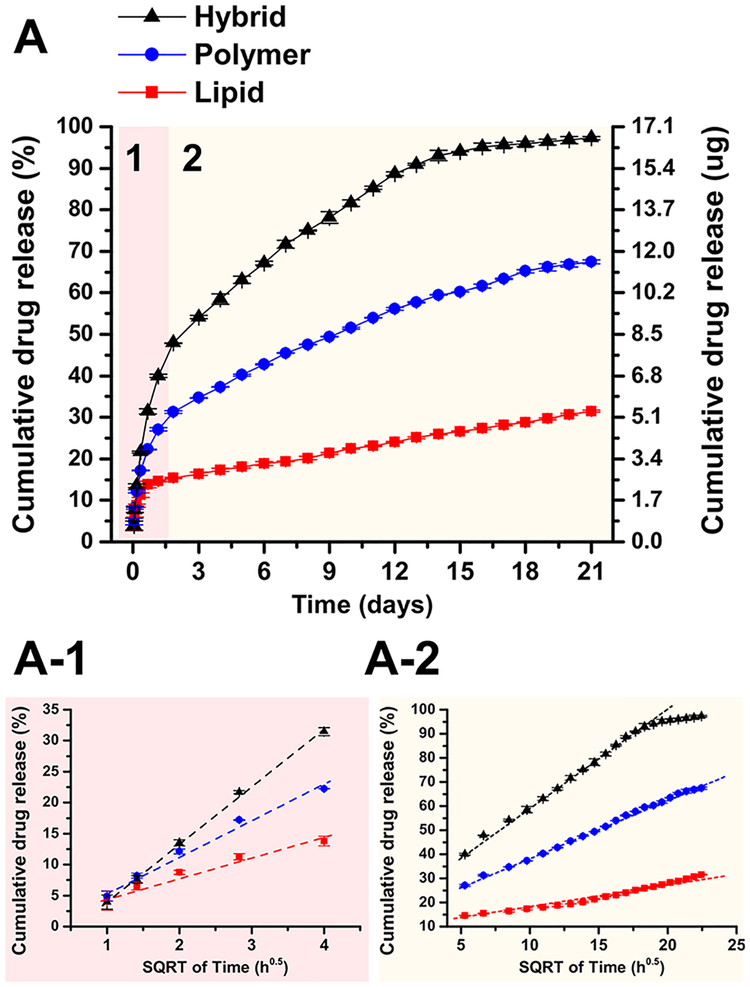
Figure 6.
(A) Cumulative release profiles of PTX from 1:1 molar ratio of DPPC to PBD-b-PEO hybrid (black triangles), PBD-b-PEO (blue circles), and DPPC (red squares) films with 2 mol % PTX incorporated. The hybrid films showed significantly higher and faster PTX release compared to single-component control films. The PTX release profiles showed two characteristic release stages: initial fast release and slower release afterward. (A-1, A-2) Each stage of PTX release profile was plotted against the square root of time to show that PTX release follows diffusion-controlled kinetics (Higuchi model97). The dashed lines indicate the linear relationship between the square root of time versus cumulative drug release. All values are the arithmetic mean ± SD, n = 3.

