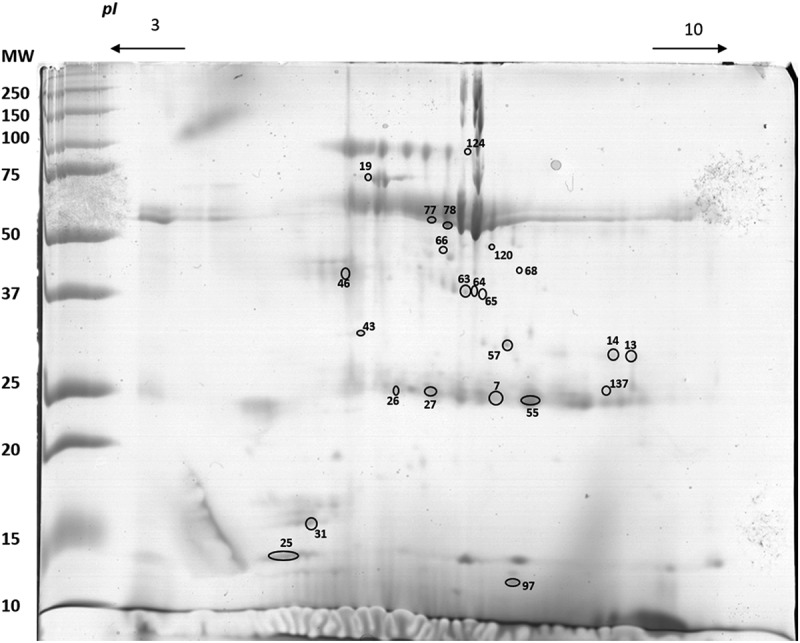
Figure 2.

Representative 2-DE profile of saliva analysed. Circles represent the spots differentially expressed between sensitive and low-sensitive groups.
MW – molecular weight (kDa); pI – isoelectric point.

Representative 2-DE profile of saliva analysed. Circles represent the spots differentially expressed between sensitive and low-sensitive groups.
MW – molecular weight (kDa); pI – isoelectric point.