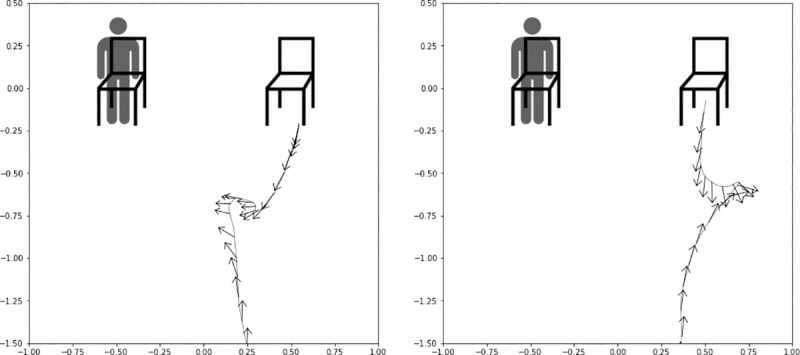
Fig 6. Examples of tracking data visualization of participants.

Left panel shows a participant rotating to face the agent (left) and the center panel shows a participant rotating to turn their back to the agent (center). The head orientation (yaw) and head position (x, z) data were collected at 60 Hz. The line depicts the head position along the x-z plane as participants walked, and each arrow depicts the direction on yaw at that position sample.
