. 2019 May 14;8:e44026. doi: 10.7554/eLife.44026

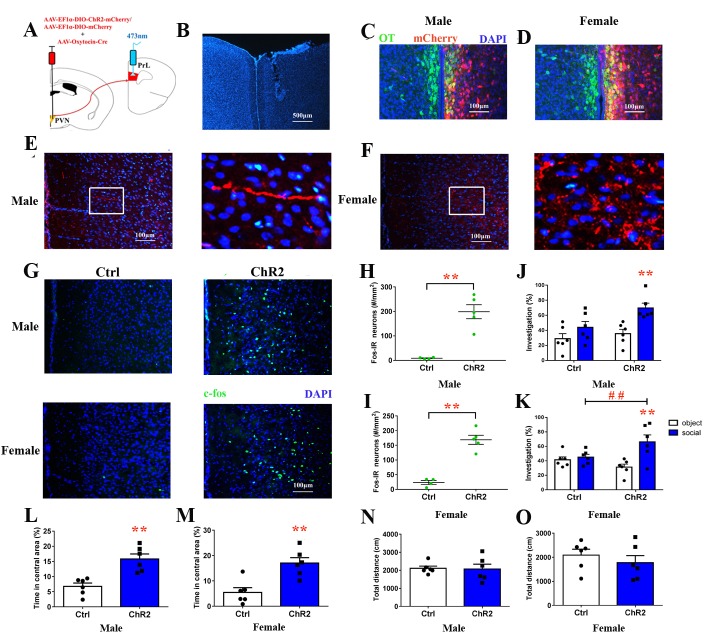
Figure 7. Optogenetic stimulation of OT terminals rescued changes in emotion and social preference behavior that were induced by paternal deprivation.

(A) Schematic drawing of the locations of rAAV-Ef1α-DIO-ChR2-mCherry plus rAAV-Oxytocin-Cre or rAAV-Ef1α-DIO-mCherry plus rAAV-Oxytocin-Cre injection into the right PVN and optic fiber implants. (B) Immunohistological image showing the targetting of fiber implants in the right PrL. Colocalization of ChR2-mCherry (red), OT neurons (green) and DAPI (blue) in the PVN of (C) males and (D) females. Confocal images of axonal mCherry signal in the PrL of (E) males and (F) females. (G) Images show expression of c-fos in the PrL after photostimulation. Quantification of c-fos in the PrL of (H) males (Ctrl: n = 4; ChR2: n = 5) and (I) females (Ctrl: n = 4; ChR2: n = 5) after photostimulation. Optogenetic activation of oxytocinergic fibers in the PrL increases social preference of (J) males (n = 6) and (K) females (n = 6). **p<0.01 vs. object stimulus. ## p<0.01 vs. Ctrl. Two-way ANOVA (factors: photostimulation treatment × stimulus type). Activation of PVN-PrL oxytocinergic projection significantly increased the percentage of time in the central area for both (L) males (n = 6) and (M) females (n = 6), but did not influence total distance traveled for (N) males (n = 6) or (O) females (n = 6). *p<0.05; **p<0.01. Independent sample t-tests. Error bars indicate SEM.

Figure 7—source data 1. Statistical result of levels of c-fos in the PrL after optogenetic activation of PrL-projecting PVN OTergic neurons during the open field, the social preference test.
DOI: 10.7554/eLife.44026.021

Figure 7.

Figure 7—figure supplement 1. Histology and immunostaining.

Figure 7—figure supplement 1.

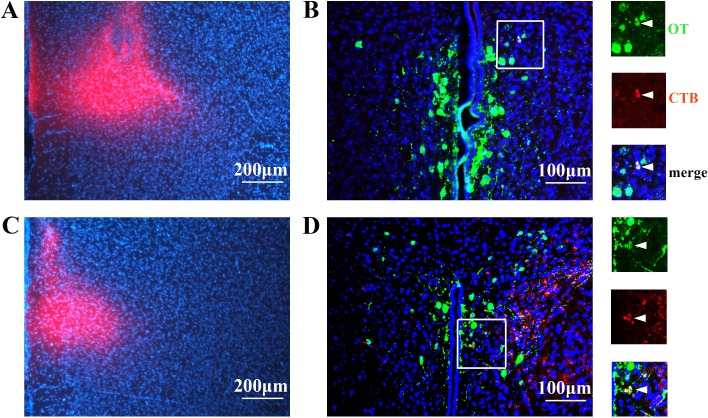
The histology of CTB injecting into the right PrL of (A) male and (C) female voles. Immunostaining showing colocalization of OT neurons (green) and CTB (red) in the PVN of (B) male and (D) female voles.
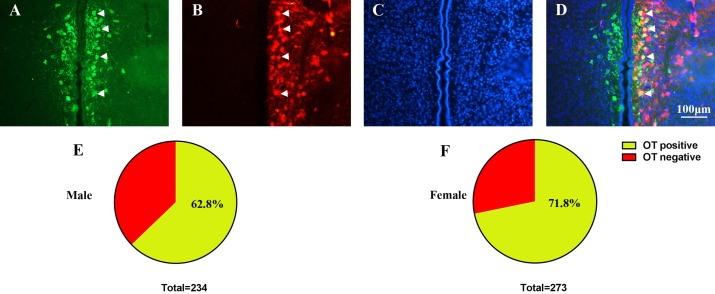
Figure 7—figure supplement 2. Immunostaining showing colocalization of mCherry (red) with OT (green) but not AVP (blue) in PVN neurons of (A) male and (B) female voles.

Figure 7—figure supplement 2.

Figure 7—figure supplement 3. Representative immunostaining allowing the vizualization of (A) OT expression (green), (B) mCherry (red) and (C) DAPI (blue) in PVN neurons of PD voles.

Figure 7—figure supplement 3.

(D) Colocalization image including bands (A), (B) and (C). Arrowheads indicate the OT, mCherry and DAPI. Quantification of OT–meCherry colocalization in (E) males (147/234 = 62.8%, from two voles) and (F) females (203/283 = 71.7%, from two voles).
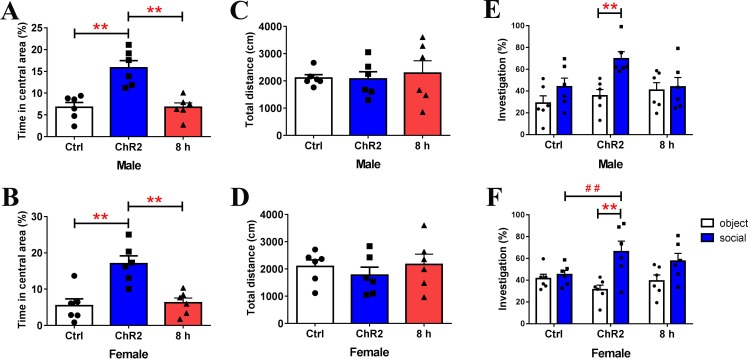
Figure 7—figure supplement 4. After activation of PVN-to-PrL OT terminals does not elicit long-lasting effects on anxiety-like behavior and social preference in PD voles (n = 6).

Figure 7—figure supplement 4.

The behavioral changes disappeared 8 hr after blue light photostimulation. Quantification of the percentage of time spent in the central area ((A): male; (B): female) and total distance traveled ((C): male; (D): female). **p<0.01. One-way ANOVA. Quantification of social preference ((E): male; F): female)). **p<0.01 vs. object stimulus. ## p<0.01 vs. Ctrl. Two-way ANOVA. Error bars indicate SEM.