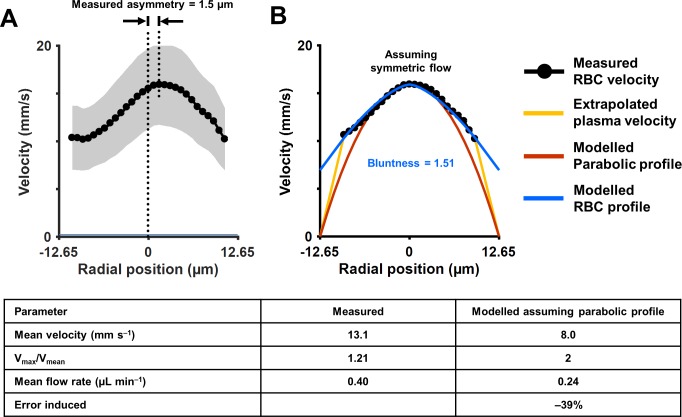
Figure 6. Measurement of cross-sectional velocity profile of a vessel only a few times larger than an RBC.
(A) Measured flow profile, averaged over all cardiac phases in 10 s of data, from the arteriole in Figure 4 (lumen diameter = 25.3 µm, typical RBC size = 6.7 µm). Profile is a flattened bell-shaped curve, in contrast to predictions of parabolic/laminar profile from Newtonian law. Slight asymmetry is observed (peak velocity is 1.5 µm away from the assigned zero position of vessel, based on the farthest cell velocities that could be reliably measured). A small gap (1.8 µm) between the known lumen diameter and the RBC column is observed, predicted to arise from the known cell-free regions near the vascular wall. Shaded region represents mean ± SD, where variation is across all ROIs in a 10 s window. Number of ROIs analyzed varied from 7333 in the lumen center to 217 near the vessel wall. (B) Assuming symmetric flow, models are fit to the measured flow profile of this vessel. The flatness of the curve is quantified using Equation 7 (blue line, Zhong et al., 2011) (bluntness index B = 1.51, scale factor β = 0.44). A parabolic profile (red line) would have B = 2 and β = 0. The plasma velocity is extrapolated using a linear-decline model (yellow line), to satisfy the no-slip boundary condition at the vascular wall. The bottom table shows that calculation of mean flow rate in the vessel using only centerline velocity and an assumption of parabolic flow profile results in a 39% underestimation of flow, underlining the importance of direct measurement of velocity profiles in vessels this small, and not relying only on models of flow.

