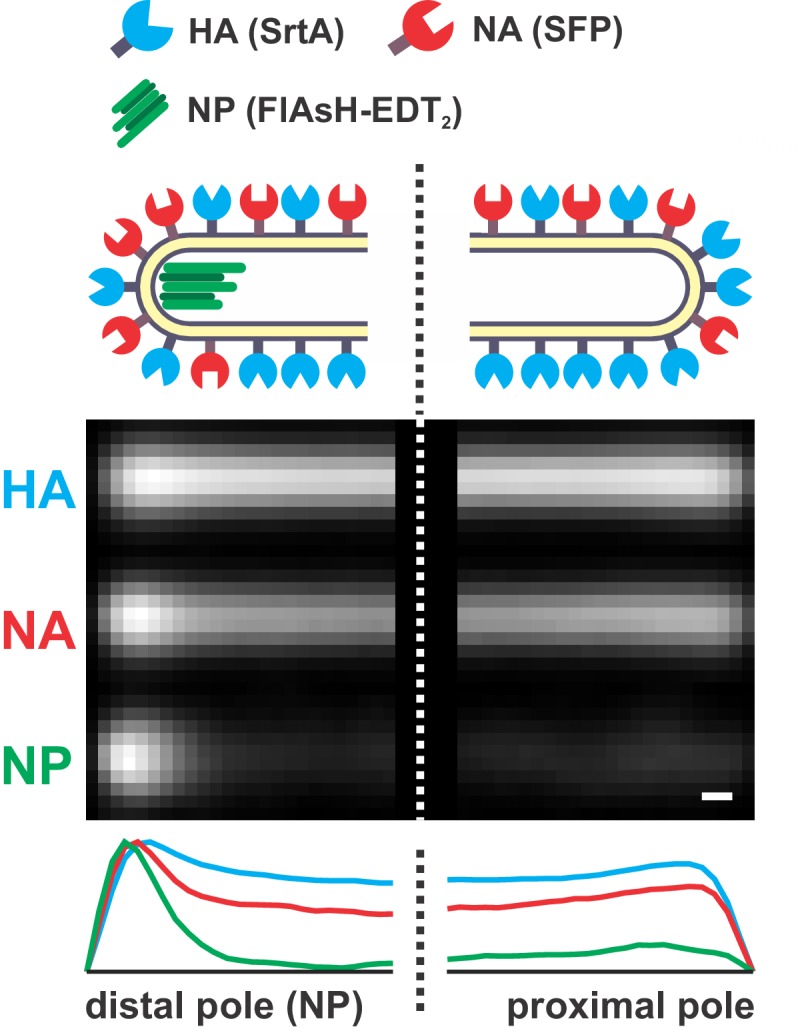
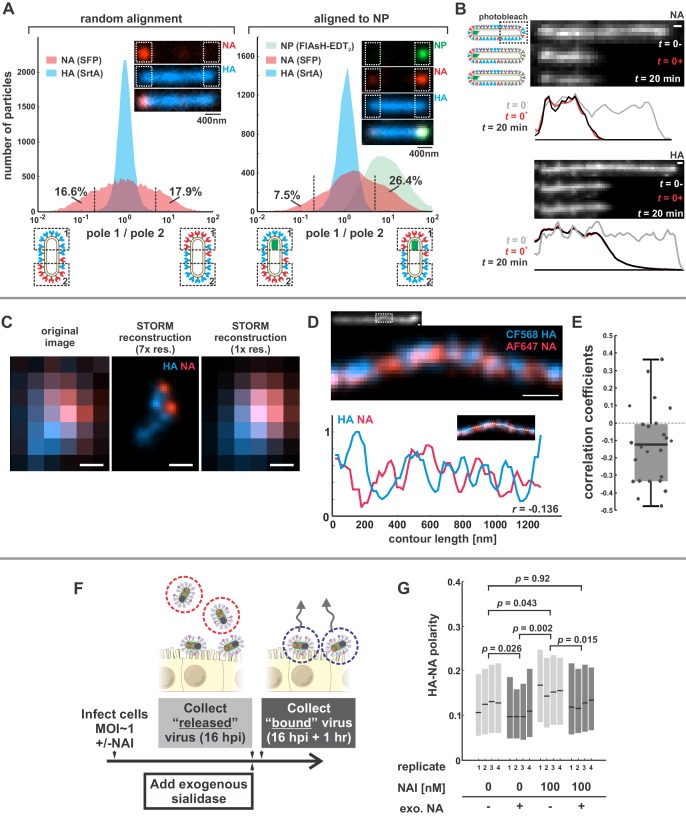
Figure 1. Organization of the IAV envelope in filamentous virus particles.
(A) Abundance of viral proteins at one viral pole relative to the other, measured as the ratio of intensities within ~400 nm of either end of the virus. The plot to the left compares HA and NA intensities for 20344 filamentous particles of at least ~1 μm in length. Approximately one third of filamentous particles have NA intensities five-fold higher on one pole than the other, as indicated by the vertical dashed lines (distributions are symmetric in this case because poles are designated randomly). Inset images show a particle with NA enrichment of ~5.6 fold (~31st percentile of particles). The plot to the right shows the same comparison for particles aligned to their NP-foci, designated as pole 1 (distributions are determined from a total of 4805 particles with polarized NP distributions). The prevalence of particles with NA ratios > 1 indicates a tendency for NA to be enriched at the virus’s genome-containing pole. Inset images show a particle with NA enrichment of ~3.3 fold (~48th percentile of particles based on NA polarity). (See also Figure 1—figure supplement 1).(B) Photobleached fluorescent NA (top) and HA (bottom) on filamentous particles show no recovery after 20 min, indicating that NA and HA are immobilized in the viral membrane (scale bar = 500 nm). Data is representative of n = 8 viruses (NA) and n = 5 viruses (HA) from three biological replicates. (C) STORM reconstructions at ~30 nm resolution of a pair of viruses unresolveable by diffraction-limited microscopy, each showing the characteristic localization of NA at one end of the virus (scale bar = 200 nm). (D) STORM reconstructions of a filamentous virus at ~30 nm resolution reveal clusters of HA and NA which partly exclude each other, illustrated by the inverse correlation in HA and NA intensities along the axis of the virus (scale bar = 200 nm). (E) Distribution of HA-NA spatial correlation coefficients from regions of 24 filamentous particles following reconstruction at ~30 nm resolution. (F) To compare populations of virus that are able to detach from infected cell to those that remain bound to the cell surface with or without NAIs, we collect virus in two separate stages: first, we harvest virus from media at 16hpi, followed by the addition of media supplemented with an exogenous, oseltamivir-resistant bacterial neuraminidase. After one hour of treatment with exogenous NA, we harvest virus that had previously remained bound to the cell surface. (G) Plot showing the HA-NA polarity of viruses released in the presence or absence of NAI and exogenous sialidase. Boxes show median values of HA-NA polarity and 25th-75th percentile ranges for each of four biological replicates, with between 499 and 2067 filamentous viruses each (p-values determined using a paired-sample T-test). See also Figure 1—source data 1.
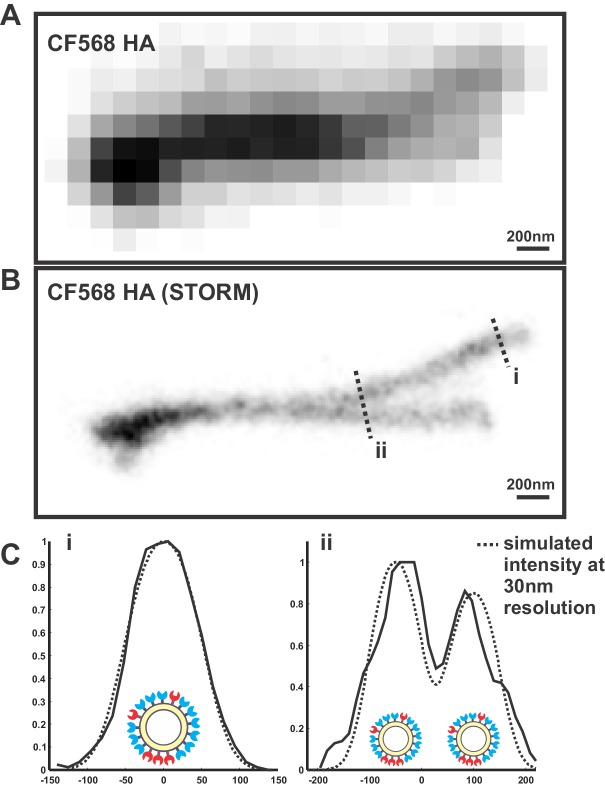
Figure 1—figure supplement 1. Distribution of HA, NA, and NP in filamentous particles.


