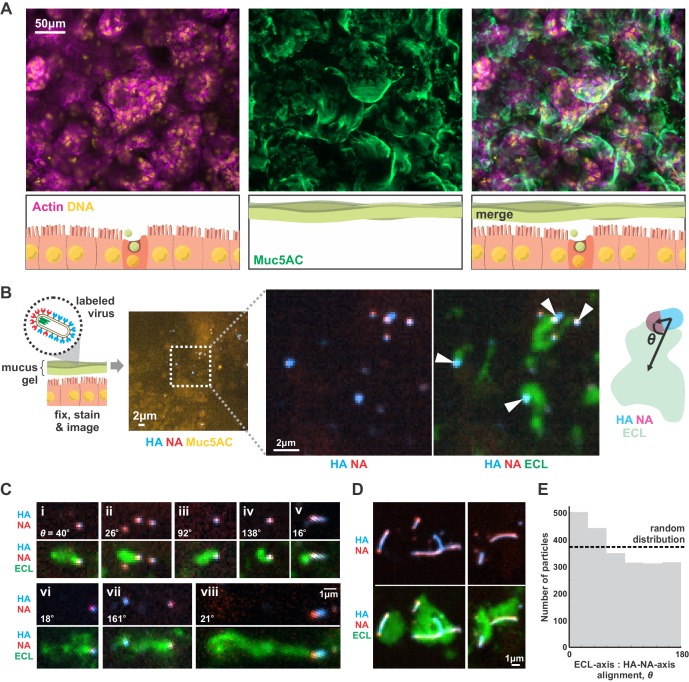
Figure 4. IAV exhibits persistent directional mobility in native mucus gels.
(A) Calu-3 cells cultured at an air-liquid interface for ~10 days partially differentiate, secreting gel-forming mucins (visualized with an antibody against Muc5AC). (B) Labeled virus (fluorescent HA and NA) added to the mucosal surface bind and diffuse. Labeling with ECL reveals distinct tracks trailing up to several microns behind viruses (indicated with white arrows). The angle θ characterizes the alignment between the HA-NA axis of the virus and the displacement from the centroid of ECL labeling. (C) Panels (i-viii) of registered viruses showing ECL trails. Where polarized distributions of NA on the virus are visible (i, v, vi, viii), ECL labeling is most prominent trailing from the NA-rich pole. Calculated values of the angle θ are given in the lower left of each panel. (D) Larger filamentous virions with NA broadly distributed across their surfaces clear large patches of sialic acid on the mucosal surface. Images in B, C, and D are a representative sampling from three biological replicates. (E) Orientation of virus HA-NA axes with ECL displacement vectors (the angle θ defined schematically in B). The distribution shows alignments for 2242 virus particles with non-overlapping ECL tracks, pooled from three biological replicates. Dashed line indicates the expected level for a uniform random distribution of alignments. See also Figure 4—source data 1.


