. 2019 May 14;8:e39905. doi: 10.7554/eLife.39905

Figure 1. Increased mast cell degranulation and tryptase release in osteoarthritis.

(a) Tosyl-Gly-Pro-Lys-pNA-based quantification of active tryptase in synovial fluids from individuals with osteoarthritis (OA; n = 35) and from individuals with prior joint trauma but no radiographic osteoarthritis (PT non-OA; n = 16). Bars represent mean ± s.d. **p≤0.01 by Mann-Whitney test, and results are representative of the results of three independent experiments performed using two independent sample sets. (b) Representative transmission electron microscopy images of osteoarthritic and non-osteoarthritic synovial tissue sections immuno-labeled with a gold-conjugated anti-tryptase antibody. Left panels: A quiescent mast cell with many cytoplasmic granules exhibiting strong immunoreactivity for tryptase and an intact plasma membrane (black arrowheads) in non-osteoarthritic synovial lining (Non-OA). Right panels: A degranulated mast cell exhibiting an exteriorized granule matrix with tryptase immunoreactivity (red arrowhead) in an osteoarthritic synovial lining (OA). There is also some other tryptase immunoreactivity apparent outside of this cell (blue arrowheads), likely derived from exteriorized granule matrices. Lower panels are higher magnification (8000×) images of area shown in blue box in the corresponding upper panels (1500×). (c) Percentage of degranulated mast cells in synovial tissues obtained from individuals with osteoarthritis (n = 5) and non-osteoarthritis (n = 5). Intact and degranulated mast cells were counted by an examiner blinded to sample group assignment. Data are mean ± s.d. **p<0.01 by Student’s t-test, and are representative of three independent experiments using independent sample sets.

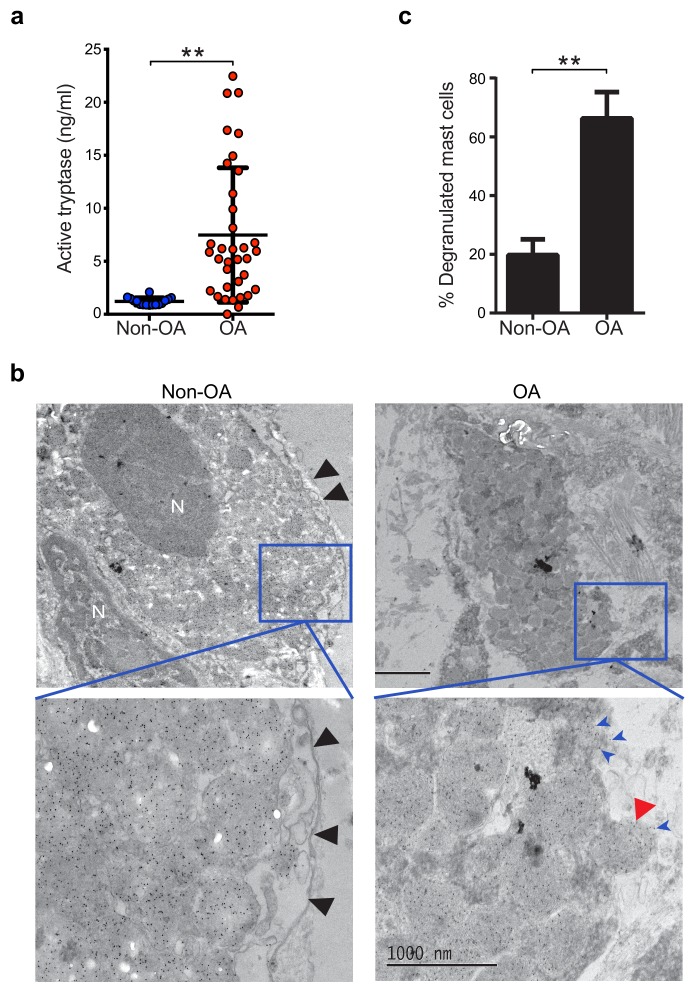
Figure 1.

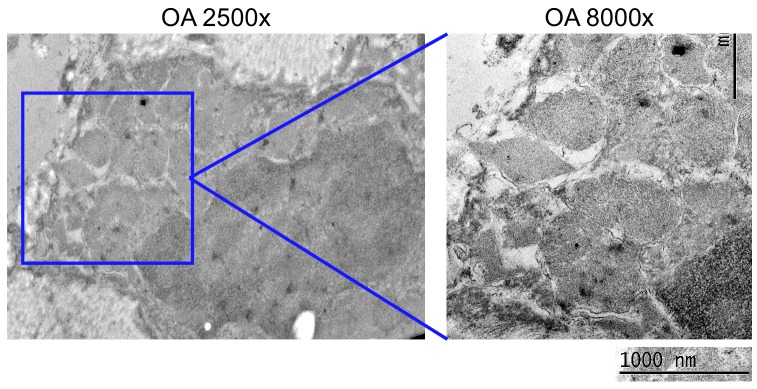
Figure 1—figure supplement 1. Transmission electron microscopy (TEM) isotype control immuno-labelling analysis.

Figure 1—figure supplement 1.

Representative TEM images of an osteoarthritic synovial lining following immuno-labelling with gold-conjugated isotype-matched control antibody (isotype-matched control for the anti-tryptase antibody in Figure 1b). Presented are a representative 2,500× magnification image (left panel), and an 8,000× magnification image of the area demarcated by the red box (right panel).
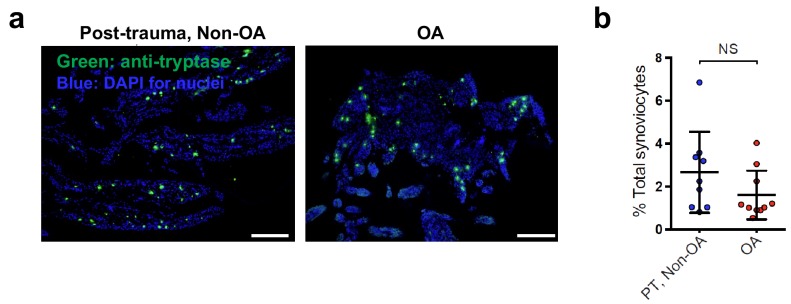
Figure 1—figure supplement 2. Mast cells are present in human osteoarthritis and post-trauma non-osteoarthritis synovial tissue.

Figure 1—figure supplement 2.

(a) Synovial tissue samples from osteoarthritis (OA) and post-trauma non-OA joints were stained with anti-tryptase antibody to identify mast cells (representative images are provided). (b) Quantification of the number of tryptase+ mast cells per high powered field in each synovial sample. The mean % of total synoviocytes for each synovial sample is displayed. Statistical comparison of the OA vs. PT, Non-OA groups were performed using Student’s t test (NS = non-significant).
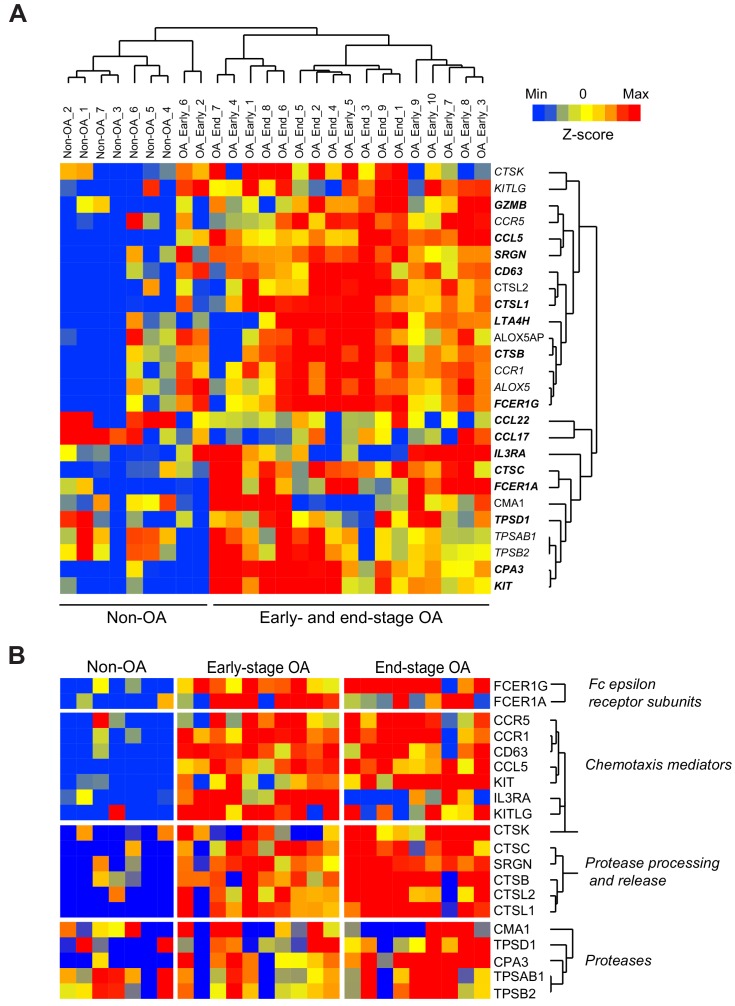
Figure 1—figure supplement 3. Expression of mast cell mediators in osteoarthritic synovial membranes.

Figure 1—figure supplement 3.

(a) Unsupervised hierarchical cluster analysis of microarray-based gene expression profiles in synovial membranes derived from individuals with early- or end-stage osteoarthritis or healthy synovium (downloaded from NCBI Gene Expression Omnibus, accession code GSE32317), with analyses limited to genes related to mast cell development, survival, function, and activation. (b) Supervised hierarchical cluster analyses of gene expression profiles in microarray datasets from synovial membranes of individuals with early- or end-stage osteoarthritis and healthy control synovium using a set of genes restricted to mast cell differentiation, chemotaxis, and function. Scale represents Z-scores.