. 2019 May 14;8:e39905. doi: 10.7554/eLife.39905

Figure 2. Genetic deficiency or pharmacologic inhibition of mast cells protects against the development of osteoarthritis in mice.

(a–d) Cartilage degradation in medial regions of stifle joints from C57BL/6J mast cell-sufficient mice (Wild-type +PBS; n = 7), mast cell-deficient mice (KitW-sh/W-sh + PBS; n = 5), and mast cell-deficient mice engrafted with BMCMCs (KitW-sh/W-sh + BMCMCs; n = 5) 20 weeks after DMM surgery. Representative Safranin-O-stained sections of medial regions of stifle joints from these mice are shown (a); arrowheads show severe cartilage loss. Cartilage degradation (b), osteophyte formation (c), and synovitis (d) in medial regions of stifle joints from these mice are quantified. (e–h) Cartilage degradation in medial regions of stifle joints from C57BL/6J mice subjected to DMM surgery and then treated by oral gavage with vehicle (n = 8) or imatinib 100 mg/kg/d (n = 6) for 12 weeks. Representative Safranin-O stained medial stifle joint sections from these mice are shown (e); arrowheads show severe cartilage loss. Cartilage degeneration (f), osteophyte formation (g), and synovitis (h) in medial regions of stifle joints from these mice are quantified. Symbols represent scores from individual mice. Bars denote mean ± s.d. *p≤0.05, **p≤0.01, by multiple comparisons one-way ANOVA. Scale bars, 200 μm. Scoring of joint pathologies was done by an investigator blinded to the experimental groups. Results are representative of three independent experiments for imatinib treatment, and two independent experiments for KitW-sh/W-sh deficient mice. PBS, phosphate-buffered saline; BMCMCs, bone marrow-derived cultured mast cells; DMM, destabilization of the medical meniscus.

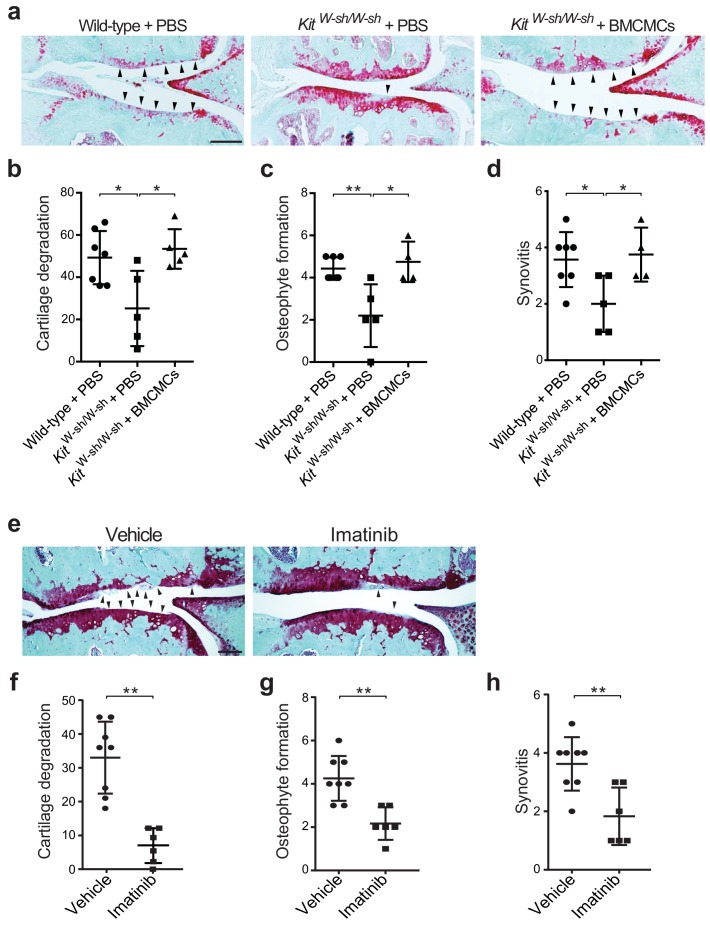
Figure 2.

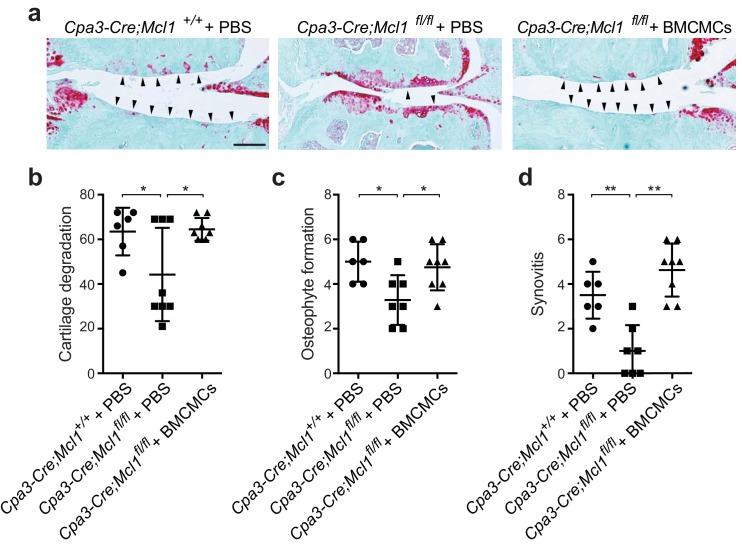
Figure 2—figure supplement 1. Genetic elimination of mast cells in a c-kit independent mouse model attenuates osteoarthritic development and severity.

Figure 2—figure supplement 1.

(a-d) Cartilage degradation in medial regions of stifle joints from Cpa3-Cre;Mcl1+/+ mast cell-sufficient mice (Cpa3-Cre;Mcl1+/+ + PBS; n=6), cKit-independent (Cpa3-Cre;Mcl1fl/fl) mast cell-deficient mice (Cpa3-Cre;Mcl1fl/fl + PBS; n=7), and Cpa3-Cre;Mcl1fl/fl mice engrafted with BMCMCs (Cpa3-Cre;Mcl1fl/fl + BMCMCs; n=8) 20 weeks after DMM surgery. Representative safranin-O-stained sections of medial regions of stifle joints from these mice are shown (a); arrowheads show severe cartilage loss. Cartilage degradation (b), osteophyte formation (c), and synovitis (d) in medial regions of stifle joints from these mice are quantified. Symbols represent scores from individual mice. Bars denote mean ± s.d. *P≤0.05, **P≤0.01 by multiple comparisons one-way ANOVA. Scale bars, 200μm. Scoring of joint pathologies was done by two investigators blinded to experimental groups. Data are representative of two independent experiments with similar results. PBS, phosphate-buffered saline; BMCMCs, bone marrow-derived cultured mast cells; DMM, destabilization of the medial meniscus.
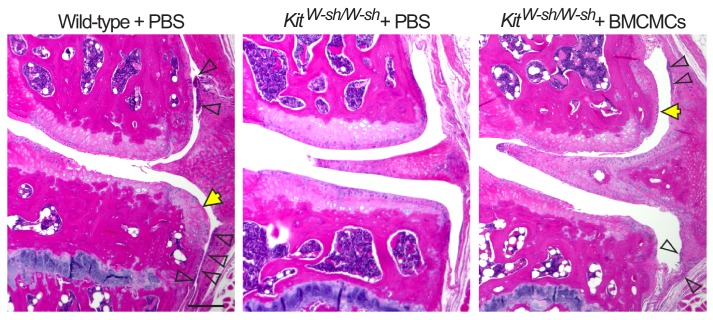
Figure 2—figure supplement 2. Genetic deficiency of mast cells reduces synovitis and osteophyte formation following DMM.

Figure 2—figure supplement 2.

Representative H&E-stained knee joint of stifle joints from C57BL/6J mast cell-sufficient mice (wild-type + PBS), mast cell-deficient mice (KitW-sh/W-sh + PBS), and mast cell-deficient mice engrafted with BMCMCs (KitW-sh/W-sh + BMCMCs) 20 weeks after DMM surgery. Open arrows indicate synovial inflammation or synovial thickening, yellow arrow indicates osteophyte. Scale bars, 200μm. *P ≤0.05 by Student’s t test.
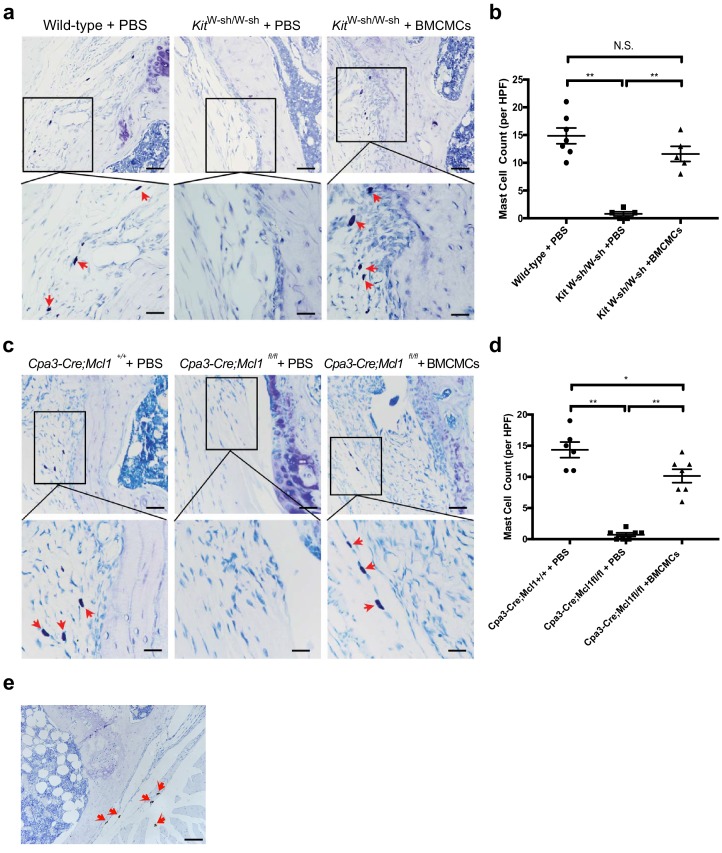
Figure 2—figure supplement 3. Staining of mast cells in the synovium of mast cell-deficient and mast cell-engrafted mice following DMM.

Figure 2—figure supplement 3.

(a) Representative toluidine blue stained sections of stifle joints from c-kit-dependent mast cell-deficient KitW-sh/W-sh mice (KitW-sh/W-sh + PBS), c-kit-dependent mast cell-deficient mice engrafted with BMCMCs (KitW-sh/W-sh + BMCMCs), and C57BL/6J mast cell-sufficient mice (Wild-type + PBS). Mast cells (red arrows in high magnification images) were present in mast cell-sufficient controls (Wild-type + PBS, left panels) and mast cell-engrafted mice (KitW-sh/W-sh + BMCMCs, right panels), but not in the mast cell-deficient mice (KitW-sh/W-sh + PBS, middle panels). (b) Quantification of toluidine blue-stained mast cells in (a). (c) Representative toluidine blue staining of stifle joint sections from c-kit-independent (Cpa3-Cre;Mcl1fl/fl) mast cell-deficient mice (Cpa3-Cre;Mcl1fl/fl + PBS), Cpa3-Cre;Mcl1fl/fl mice engrafted with BMCMCs (Cpa3-Cre;Mcl1fl/fl + BMCMCs), and Cpa3-Cre;Mcl1+/+ mast cell-sufficient control mice (Cpa3-Cre;Mcl1+/+ + PBS). Mast cells (red arrows in high magnification images) were present in mast cell-sufficient controls (Cpa3-Cre;Mcl1+/+ + PBS, left panels) and mast cell-engrafted mice (Cpa3-Cre;Mcl1fl/fl + BMCMCs, right panels), but not in the mast cell-deficient mice (Cpa3-Cre;Mcl1fl/fl + PBS, middle panels). (d) Quantification of toluidine blue-stained mast cells in (c). (e) To further characterize Cpa3-Cre;Mcl1fl/fl mice that developed cartilage degeneration (Figure 2—figure supplement 1b), anti-tryptase antibody staining was performed on sections of the affected joints. Tryptase-positive mast cells (red arrows) were identified in the joints of most Cpa3-Cre;Mcl1fl/fl mice that developed osteoarthritis. Scale bars are 200μm for the lower magnification images (upper panels), and 50 μm for the higher magnification images (lower panels). DMM, destabilization of the medial meniscus. Statistical comparisons were performed using Tukey’s multiple comparison test (*P <0.05, **P < 0.01). PBS, phosphate-buffered saline. BMCMCs, bone marrow-derived cultured mast cells.
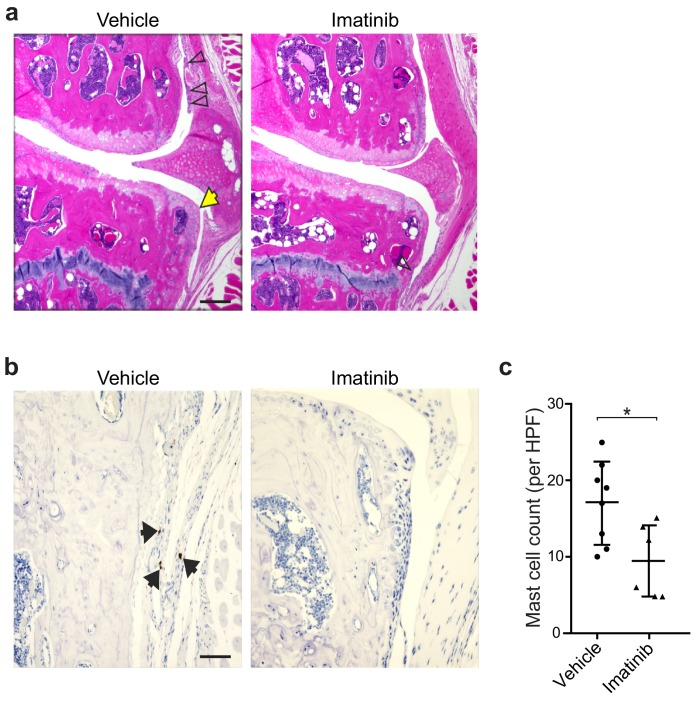
Figure 2—figure supplement 4. Pharmacologic inhibition of mast cells by imatinib reduces synovitis and osteophyte formation following DMM.

Figure 2—figure supplement 4.

(a) Representative H&E-stained knee joint of stifle joints from C57BL/6J mice treated with vehicle or imatinib for 12 weeks following DMM surgery. (b) Representative immunohistochemical staining with anti-tryptase antibodies of stifle joints from C57BL/6J mice treated with vehicle or imatinib. Black arrows indicate tryptase+ (brown) mast cells. (c) Quantification of tryptase-positive cells in high power field images from knees of mice described in (b). Scale bars, 200μm. *P ≤0.05 by Student’s t test.