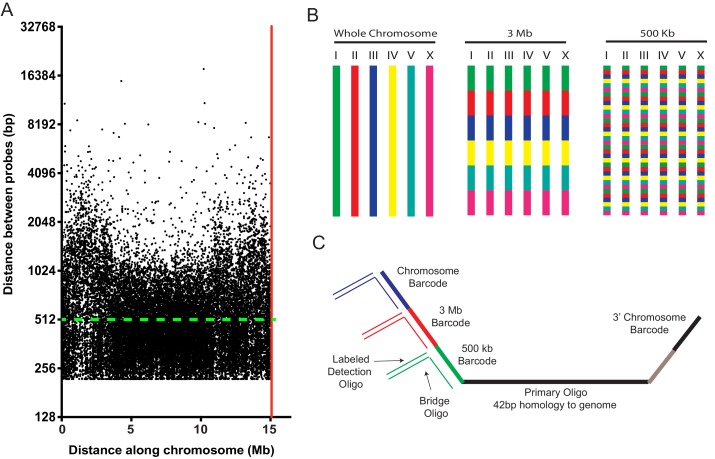
Figure 1. A highly multiplexed oligo library for C. elegans Oligopaint.
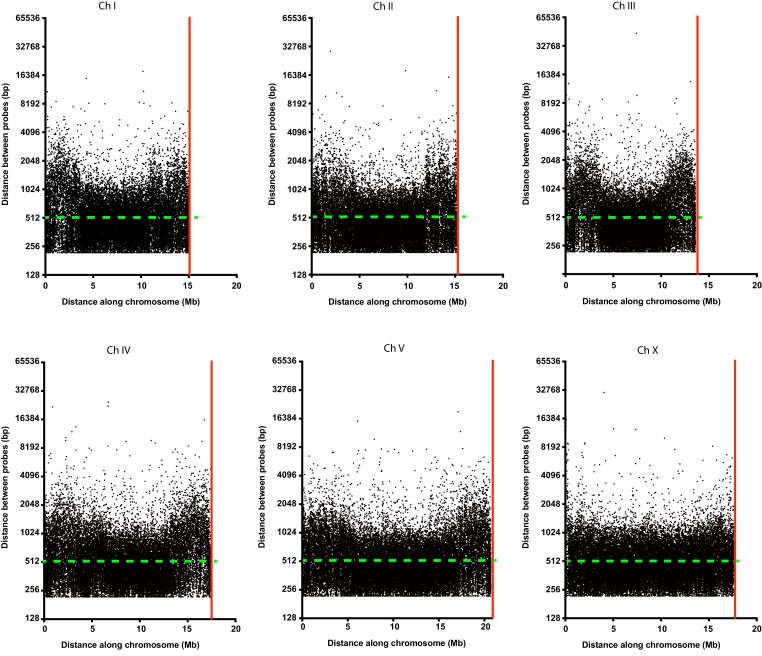
(A) The distribution of Oligopaint probes across chromosome I is shown. Green dashed line indicates the two probe/kb average. Red line indicates the end of the chromosome. Probe distribution is similar for other chromosomes (see Table 1 and Figure 1—figure supplement 1). (B) Oligopaint library allows primary oligos, which are specific to any chromosome, 3 Mb, or 500 Kb region within any chromosome, to be specifically amplified. Primary probes are PCR amplified from Oligopaint library and produced as described in Materials and methods. Bridge and detection probes allow the indicated chromosomal regions to be visualized. (C) Primary probes consist of barcode sequences appended to 42 bp sequences that hybridize uniquely to the C. elegans genome. Total length of each oligo is 150 bp. Barcode sequences allow each primary probe to be amplified as part of a pool of primary probes that target a chromosome (chromosome barcode), 3 Mb subsection of chromosome (3 Mb barcode), or 500 kb subsection of chromosome (500 kb barcode). Bridge oligos and Detection oligos (arrows) are used to recognize and illuminate primary probes. Note: primary oligos contain an additional barcode not used in this work (brown). The barcode is specific to each 500 kb segment and could be used to increase detection efficiencies of 500 kb DNA FISH by allowing an addition detection oligo to be incorporated during the detection phase of DNA FISH.


