. 2019 May 14;8:e42823. doi: 10.7554/eLife.42823

Figure 2. Whole chromosome Oligopaint in C. elegans is specific.

(A–C) Adult C. elegans were fixed as described in Materials and methods. Fixed animals were subjected to three step hybridization to detect Chromosome 2 (red). Animals were co-stained with DAPI (blue). (A) 3D maximum projection of the pachytene region of an adult C. elegans germline is shown. (B) 3D maximum projection of an oocyte. A single bivalent is stained with chromosome II Oligopaints. (C) 3D maximum projection of sperm. Scale bars for images are indicated. All images are representative of at least three independent animals.

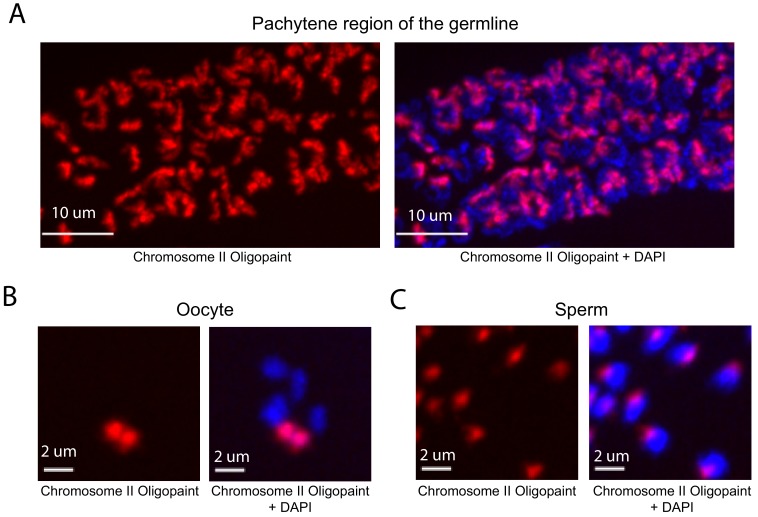
Figure 2.

Figure 2—figure supplement 1. X chromosome Oligopaint on him-8 (e1489) mutant animals.

Figure 2—figure supplement 1.

(A) X chromosome Oligopaint (red) and DAPI (blue) visualized in three C. elegans oocytes from wild type (top) and him-8 (e1489) bottom. Note the presence of two DNA FISH signals in the him-8 (e1489) mutant animals compared to a signal DNA FISH signal observed in wild-type animals. (B) Quantifications of X chromosome Oligopaint signals in wild type and him-8 (e1489) mutant animals. All images are representative of at least three independent animals.
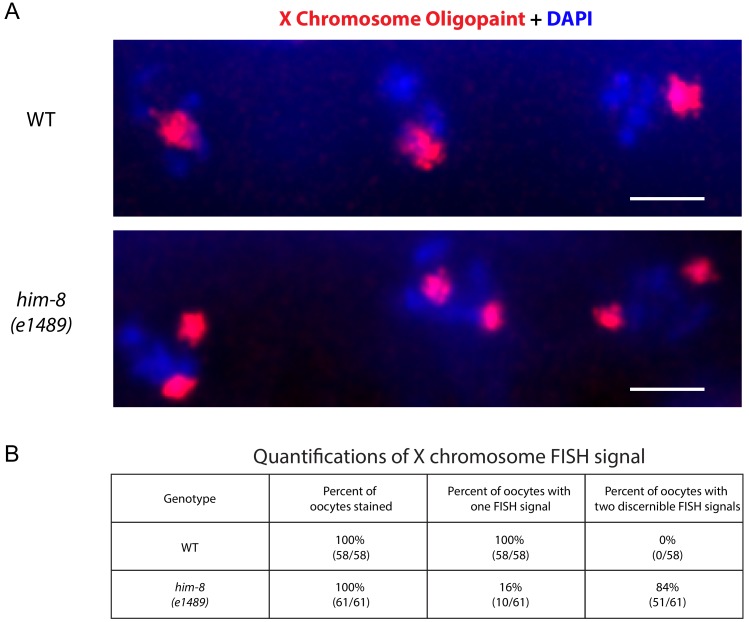
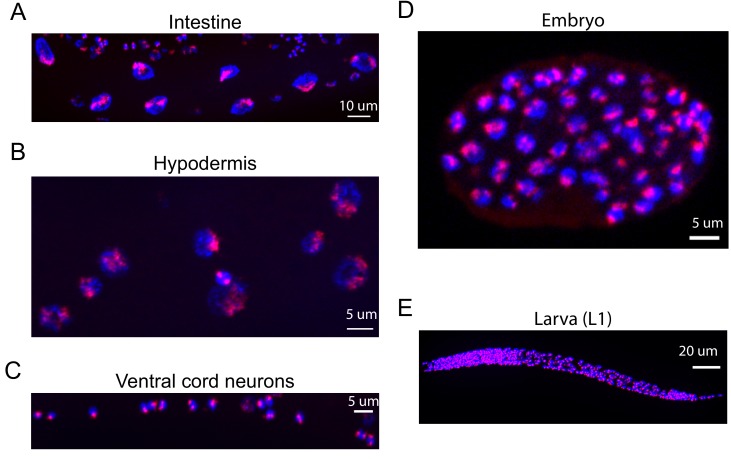
Figure 2—figure supplement 2. Oligopaints stain chromosomes in all/most somatic cells and in all/most developmental stages of C. elegans.

Figure 2—figure supplement 2.

Mixed stage samples of C. elegans were subjected to three-step hybridization to detect Chromosome II as described in Materials and methods. Chromosome II staining is shown in red. Animals were co-stained with DAPI (blue). Scale bars are indicated. (A) Intestinal nuclei, (B) hypodermal nuclei, (C) ventral cord neurons, (D) ~ 100 cell embryo, and (E) larval stage one animal. All images are representative of at least three independent animals.