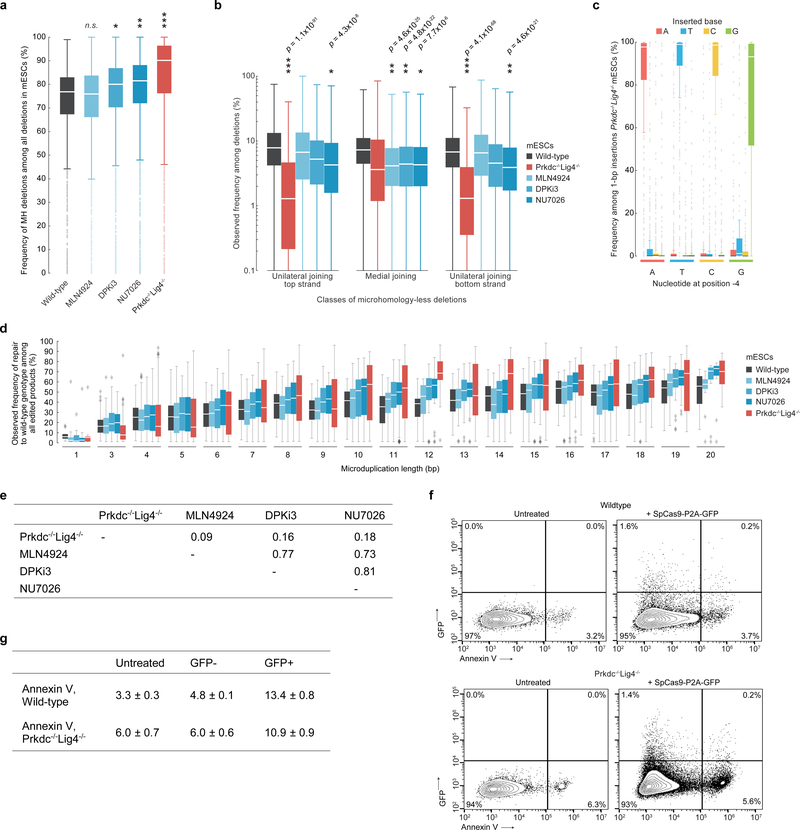
Extended Data Figure 6: Altered distributions of Cas9-mediated genotypic products in Prkdc−/−Lig4−/− mESCs and mESCs treated with DPKi3, NU7026, and MLN4924 as compared to wild-type mESCs.
a, Comparison of MH deletions among all deletions at Lib-B target sites in wild-type (n = 1,909 target sites), DPKi3 (n = 1,999), MLN4924 (n = 1,995), NU7026 (n = 1,999), and Prkdc−/−Lig4−/− (n = 1,446). Statistical tests performed against wild-type population. * P = 5.6×10⁻⁵, ** P = 3.5×10⁻¹³, *** P = 5.0×10−41, two-sided Welch’s t-test. b, Comparison of the frequency of each class of MH-less deletions among all deletion products in wild-type (Lib-A and Lib-B target sites, n = 3,829 target sites), DPKi3 (Lib-B, n = 1,990), MLN4924 (Lib-B, n = 1,980), NU7026 (Lib-B, n = 1,992), and Prkdc−/−Lig4−/− (Lib-A and Lib-B target sites, n = 3,344). P values compare to wild-type, two-sided Welch’s t-test. c, Frequency of 1-bp insertions at 1,055 target sites in Lib-A in Prkdc−/−Lig4−/− mESCs. d, Frequencies of deletion repair to wild-type genotype in Lib-B in wild-type mESCs (n = 1,480 target sites, combined data from 2 technical replicates) compared to conditions, with combined data from 2 independent biological replicates for each of Prkdc−/−Lig4−/− (n = 1,041 target sites), MLN4924 (n = 1,569), NU7026 (n = 1,561), and DPKi3 (n = 1,563). e, Table of Pearson r of the change in disease correction frequency compared to wild-type at n = 791 target sites for each pair of conditions. f, g, Annexin V-568 staining flow cytometry contour plots (f) and mean ± s.d. values (g) in wildtype and Prkdc−/−Lig4−/− Lib-A mESCs following transfection with SpCas9-P2A-GFP (representative data for n = 2 experiments). Box plots denote the 25th, 50th, and 75th percentiles, whiskers show 1.5 times the interquartile range, and outliers are depicted as fliers. For detailed statistics on significance tests, see online methods.

