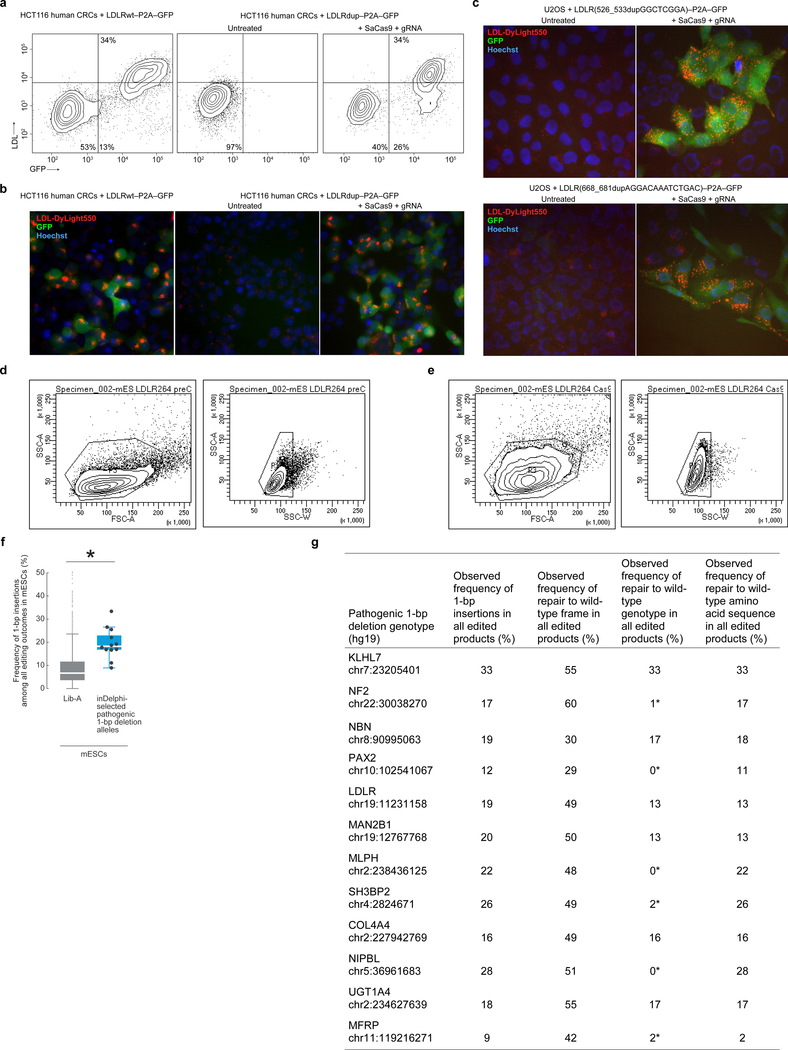
Extended Data Figure 7: Template-free Cas9-nuclease editing of human and mouse cells containing pathogenic alleles.
a, b, Flow cytometric contour plots showing GFP fluorescence and LDL-Dylight550 uptake in, (a) and fluorescence microscopy of, HCT116 cells containing the denoted LDLR alleles and treated with SaCas9 and gRNA when denoted (representative data for n = 2 experiments). c, Fluorescence microscopy of U2OS cells containing the denoted LDLR alleles and treated with SaCas9 and gRNA when denoted. (representative data for n = 2 experiments). d, e, Flow cytometry gating strategy used for mESC + LDLRdup–P2A–GFP untreated (d) and treated with SpCas9 + gRNA (e). f, g, Results of 12 pathogenic 1-bp deletion alleles selected by inDelphi for high 1-bp insertion frequency (combined data from n = 2 independent biological replicates) compared to Lib-A (f) and presented in a table (g). The box denotes the 25th, 50th, and 75th percentiles, whiskers show 1.5 times the interquartile range, and outliers are depicted as fliers. * P = 1.6×10⁻⁴, two-sided Welch’s t-test. For detailed statistics, see online methods. In the table, * indicates the most frequent 1-bp insertion genotype predicted by inDelphi does not correspond to the wild-type genotype. In fluorescence microscopy plots, GFP fluorescence is shown in green, LDL-Dylight550 uptake in red, and Hoechst staining nuclei in blue.

