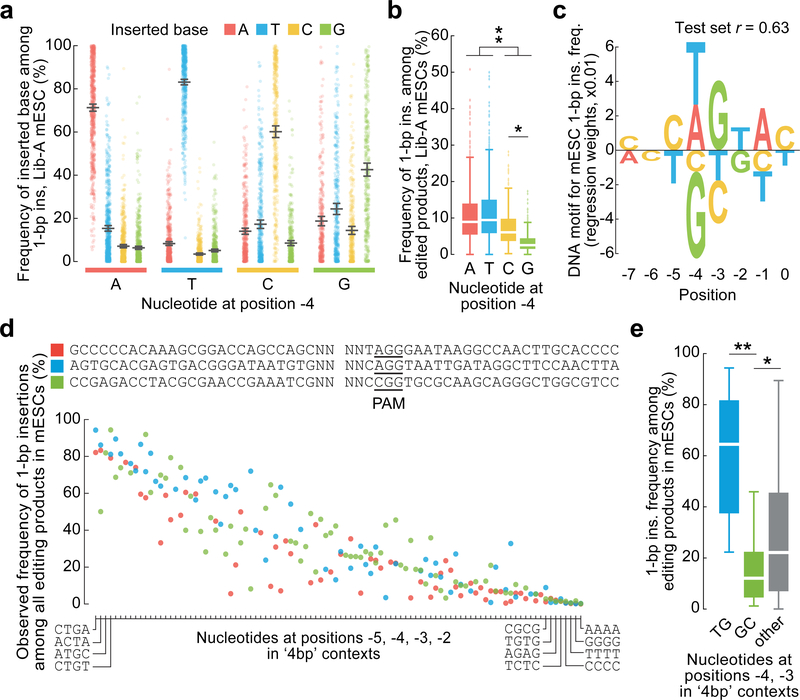
Fig. 2 |. Sequence context influences 1-bp insertions.
a, 1-bp insertion frequencies (mean ± 95% C.I.) among 1,981 Lib-A target sites. b, Comparison of 1-bp insertion frequencies among Cas9-edited products from 1,996 Lib-A target sites. The box denotes the 25th, 50th, and 75th percentiles, whiskers show 1.5 times the interquartile range, and outliers are depicted as fliers. * P = 5.4×10−36; ** P = 8.6×10−70, two-sided t-test. c, DNA motif for 1-bp insertion frequency (Lib-A, mESCs, n = 1,996 target sites). d, Frequencies of 1-bp insertions among 205 target sites with varying −5 to −2 nucleotides (relative to the PAM at positions 0–2) in three low-microhomology contexts. See Extended Data Fig. 5 for full axis labels. e, Comparison of the 1-bp insertion frequency at sequences in (c) with varying positions −4 and −3. Box plot as in (b). *P = 0.03; **P = 2.98 × 10⁻⁷, two-sided t-test.

