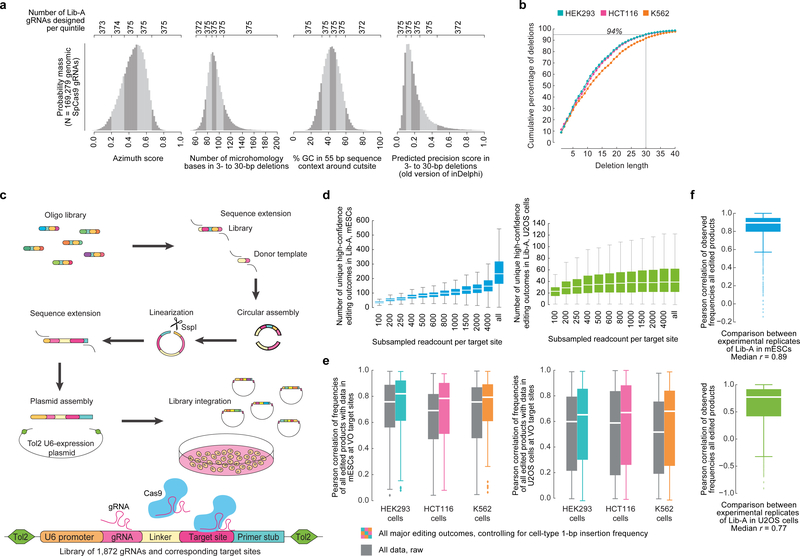
Extended Data Figure 1: Design and cloning of a high-throughput library to assess CRISPR-Cas9-mediated editing products, yielding diverse and replicate-consistent data that is concordant with repair spectra at endogenous human genomic loci.
a, Empirical distributions of various predicted and measured properties of DNA from 169,279 SpCas9 gRNA target sites in the human genome. Number of target sites per range used to design Lib-A are indicated. b, Cumulative percentage of endogenous deletions in VO target sites in HEK293 (n = 89 target sites), HCT116 (n = 92), and K562 (n = 86) that delete up to the reported number of nucleotides (X-axis). c, Schematic of the cloning process used to clone Lib-A and Lib-B (Methods, Supplementary Discussion, Supplementary Methods). d, Number of unique high-confidence editing outcomes (Supplementary Methods) called by simulating data subsampling in data in Lib-A (n = 2000 target sites) in mESCs (combined data from n = 3 independent biological replicates) and U2OS cells (combined data from n = 2 independent biological replicates). For “all”, the original non-subsampled data is presented. Each box depicts data for 2,000 target sites. Outliers not depicted. e, Pearson r of genotype frequencies comparing Lib-A in mESCs and U2OS cells with endogenous data in HEK293 (n = 87 target sites), HCT116 (n = 88), and K562 (n = 86). Outliers are depicted as fliers. 1-bp insertion frequency adjustment was performed at each target site by proportionally scaling them to be equal between two cell types. f, Pearson r of genotype frequencies at Lib-A target sites comparing two independent biological replicate experiments in mESCs (n = 1,861 target sites, median r = 0.89) and U2OS cells (n = 1,921, median r = 0.77). Outliers are depicted as fliers. Box plots denote the 25th, 50th, and 75th percentiles and whiskers show 1.5 times the interquartile range.

