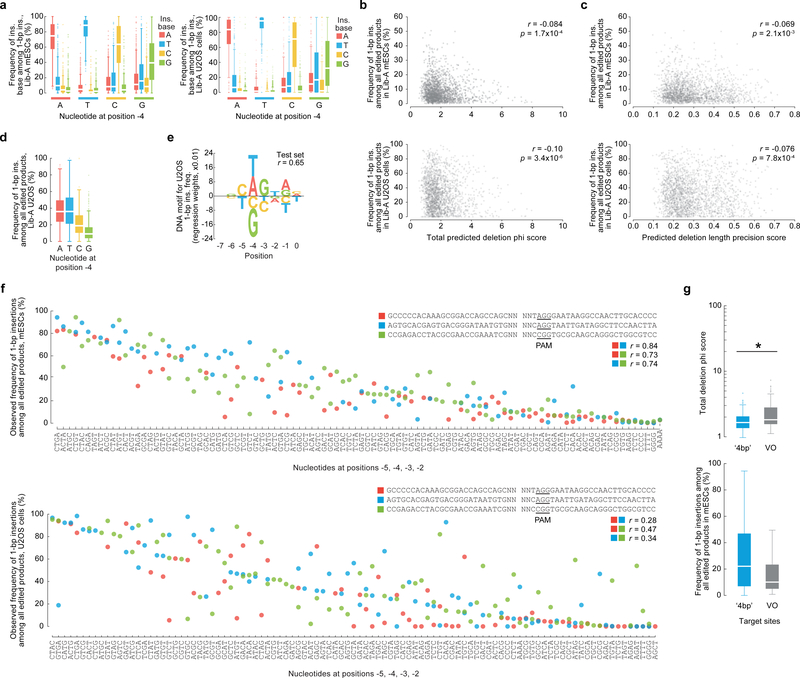
Extended Data Figure 3: Influential role of hyperlocal sequence context features in predicting and causing 1-bp insertions.
a, Frequency of 1-bp insertions in mESCs (n = 1,981 Lib-A target sites) and U2OS cells (n = 1,918) with varying −4 nucleotides. b, c, Plot of 1-bp insertion frequency in mESCs (n = 1,996 Lib-A target sites) and U2OS cells (n = 1,966) compared to their total phi score (b) and predicted deletion length precision score (c) with Pearson r. d, Comparison of 1-bp insertion frequencies among all edited products from 1,966 Lib-A target sites in U2OS cells (combined data from n = 2 independent biological replicates). e, Nucleotides and their impact on the frequency of 1-bp insertions in U2OS cells. Only bases with non-zero linear regression weights in 10,000-fold iterative cross-validation are shown. Total n = 1,966 Lib-A target sites. f, Insertion frequency in mESCs (n = 205) and U2OS cells (n = 217) when varying four bases by the cleavage site (positions −5 to −2 counted from the NGG-PAM at positions 0–2) contained within three target sites designed with weak microhomology. g, Microhomology strength (deletion phi score) and 1-bp insertions in mESCs for 312 ‘4bp’ target sites and 89 VO sequences. * P = 6.1×10⁻⁹; two-sided two-sample t-test, test statistic = −5.94, degrees of freedom = 399, Hedges’ g effect size = 0.49. Box plots denote the 25th, 50th and 75th percentiles, whiskers show 1.5 times the interquartile range, and outliers are depicted as fliers.

