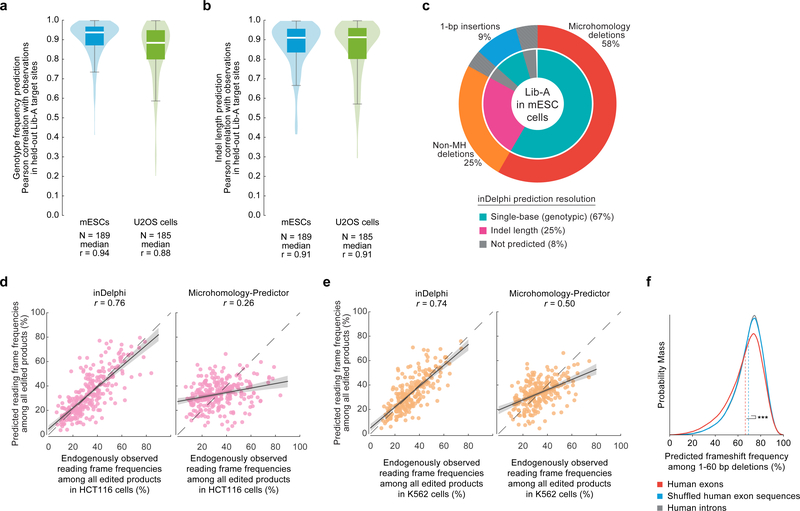
Extended Data Figure 4: inDelphi predictions represent nearly all editing outcomes and are accurate at predicting the frequencies of genotypes, indel lengths, and frameshift frequencies.
a, b, Pearson r for held-out Lib-A target sites comparing inDelphi predictions with observed frequencies for genotypes (a) and indel lengths (b) in mESCs and U2OS cells. The box denotes the 25th, 50th and 75th percentiles, whiskers show 1.5 times the interquartile range. Densities were smoothed with noise but do not extend beyond the data. c, Pie chart depicting the output of Delphi for specific outcome classes at Lib-A target sites in mESCs. d, e, Comparison of two methods for frameshift predictions to observed values with Pearson r in HCT116 cells (d, n = 91 target sites) and K562 cells (e, n = 82 target sites). The error band represents the 95% C.I. around the regression estimate with 1,000-fold bootstrapping. f, Distribution of predicted frameshift frequencies among 1–60-bp deletions for SpCas9 gRNAs targeting exons (n = 1,000,294 gRNAs, mean = 66.4%) and shuffled versions (mean = 69.3%), and introns (n = 740,759) in the human genome. Dashed lines indicate means. *** P < 10−300, two-sided Welch’s t-test, test statistic = −145.5, DoF = 1,506,304, Hedges’ g = −0.19.

