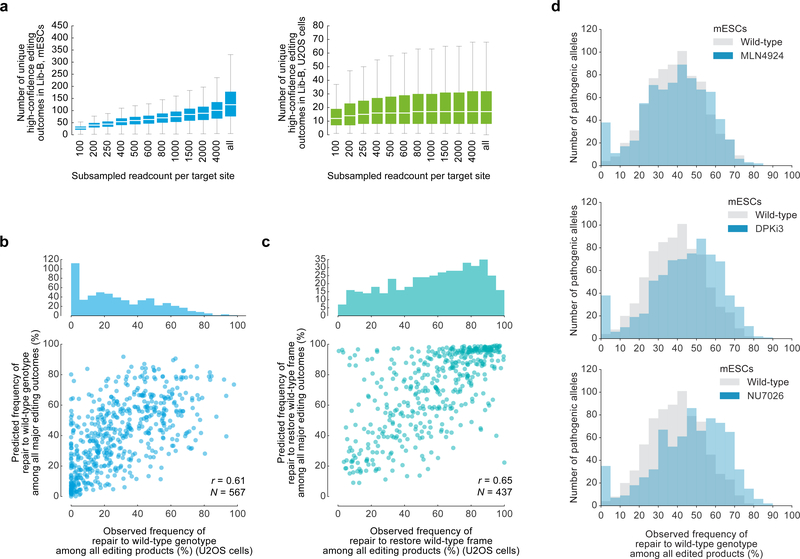
Extended Data Figure 5: Characterization of Lib-B data including pathogenic microduplication repair in wild-type mESCs, wild-type U2OS cells, and mESCs treated with DPKi3, NU7026, and MLN4924.
a, Box plots of the number of unique high-confidence editing outcomes (see Supplementary Methods) called by simulating data subsampling in data at 2,000 Lib-B target sites in mESCs (combined data from n = 2 independent technical replicates) and U2OS cells (combined data from n = 2 independent biological replicates). In “all”, the full non-subsampled data is presented (see Supplementary Table 2 for read counts). Each box depicts data for 2,000 target sites. The box denotes the 25th, 50th, and 75th percentiles and whiskers show 1.5 times the interquartile range. Outliers are not depicted. b, Frequencies of repair to wild-type genotype at 567 ClinVar pathogenic alleles vs. predicted frequencies in Lib-B in human U2OS cells with Pearson r. c, Frequencies of repair to wild-type frame at 437 ClinVar pathogenic alleles vs. predicted frequencies in Lib-B in human U2OS cells with Pearson r. d, Frequency of pathogenic microduplication repair in wild-type mESCs (n = 1,480 target sites) compared to mESCs treated with MLN4924 (n = 1,569), NU7041 (n = 1,561), and DPKi3 (n = 1,563).

