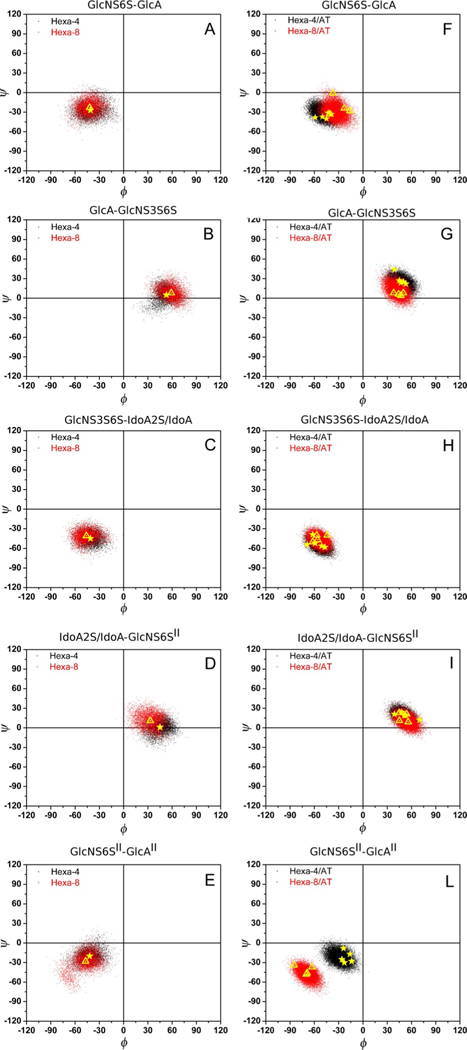
Figure 4.

Ramachandran plots of the glycosidic dihedral angles ϕ/ψ for hexa-4 and hexa-8 A)-E) in the free state and F)-L) in the bound state as sampled during MD simulations after a relaxation period of 40 and 80 ns for glycans in the free and the bound state, respectively. From the top to the bottom each panel corresponds to the glycosidic linkage on going from the non-reducing to the reducing end, as labelled on the top of each panel. In panels A)-E) the yellow stars and triangles correspond to the average values ϕ/ψ of hexa-4 and hexa-8, respectively, calculated in the free state from the MD simulation trajectories, skipping the first 40 ns (relaxation, Table S1). In panels F)-L) the yellow stars and triangles indicate ϕ/ψ values of the MD-simulated structures validated by tr-NOEs and corresponding to simulation times of 209, 227, 240, 257, 270 ns for hexa-4·AT and 214, 235, 243, 258 ns for hexa-8·AT (see paragraph on NOESYand tr-NOESY and Table S1).
