Figure 4.
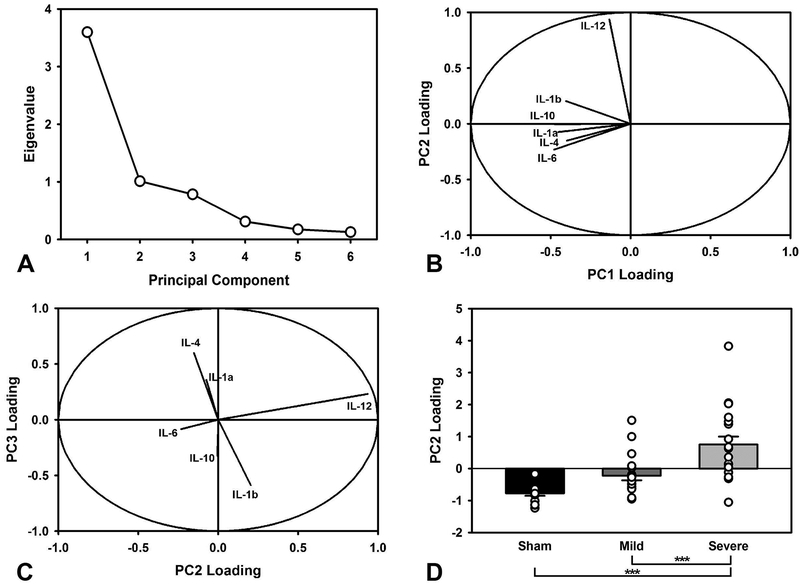
Principal components analysis of cytokine data. A) Scree plot of extracted components. The first three were selected for further analysis. B) Relative loading of different cytokines in PC1 vs. PC2, illustrating the degree to which each cytokine contributes to its component. PC2 displayed relatively common profiles, with the exception of IL-12. C) Relative loading of different cytokines in PC2 vs. PC3. PC2 revealed orthogonally opposed cytokine loadings, with IL-12 again showing the largest, and most independent effect. D) Relative PC2 loading (group mean +/− SEM; open circles represent individual data points), stratified by group. The Severe TBI group had significantly higher levels than both Sham and Mild TBI (p < 0.001, p = 0.001, respectively), which is likely driven by the strong group differences in IL-12. The Sham and Mild TBI were not significantly different (p = 0.133). *** = p < 0.001.

