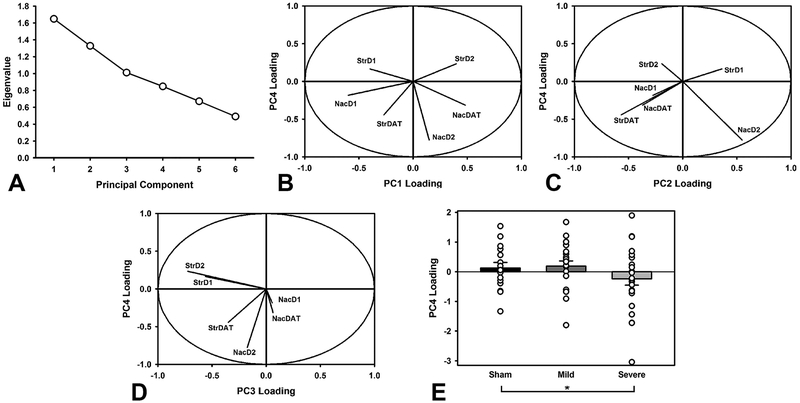
Figure 6.
Principal components analysis of markers of dopaminergic function. A) Scree plot of extracted components. The first four were selected for further analysis. B) Relative loading of different dopamine markers in PC1 vs. PC4 illustrating the degree to which each protein contributes to its component. C) Relative loading of different dopamine markers in PC2 vs. PC4. D) Relative loading of different dopamine markers in PC3 vs. PC4. E) Relative PC4 loading, stratified by injury group (group mean +/− SEM; open circles represent individual data points). The Severe TBI group had significantly lower levels than the Sham group (p = 0.028). Comparison of PC4 across these cases shows relatively opposing loadings for the accumbens versus striatum, and D1 versus D2, highlighting the importance of these relationships in TBI. * = p < 0.05.

