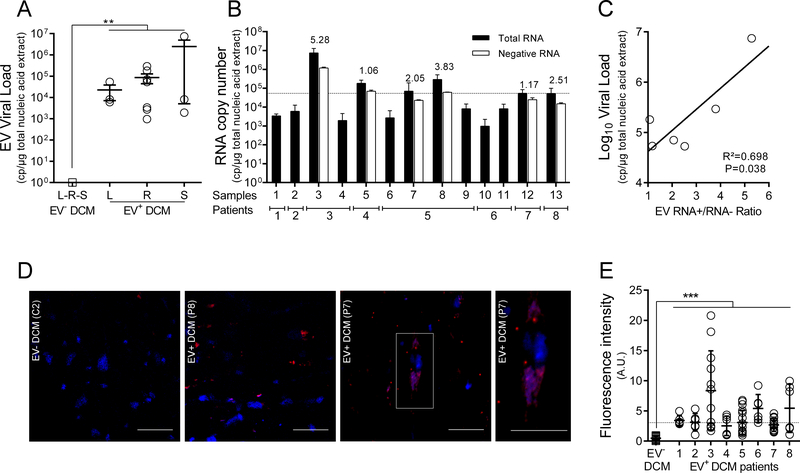
Figure 2. Detection and characterization of EV persistent infection in cardiac tissues of idiopathic DCM patients.
A. Total EV RNA levels (copies/μg of total nucleic acid extract) in cardiac tissues of EV positive IDCM patients (8 of 24 tested IDCM patients) and healthy controls (n=14) were quantified using a generic EV RT-qPCR. Dots represent patients mean values (n=8). L: Left Ventricle, R: Right Ventricle, S: Septum. **: P<0.01 by Mann-Whitney U test. B. Quantification (RT-qPCR) of total and minus EV RNA strands in tissues of 8 EV positive IDCM patients (n=13 samples) using specific primers to each RNA strand polarity. Data represent mean values ± SEM (n=13); RNA+/RNA− ratio values are indicated as an index above each sample. When RNA minus strand levels were below the threshold of quantification value, RNA+/RNA− ratios were not calculated. C. Linear regression curve between the log10 genome copies/μg and RNA+/RNA− ratio values (n=6) (P=0.038; R2=0.70). D. In situ Hybridization (ISH) targeting viral RNA (upper panels) displaying EV RNA (red) in serial cardiac tissue sections of infected DCM. Nuclei are stained in blue; Bar scale = 50 μm. White square (DCM+ EV+) corresponds to a high magnification (X400) of a single EV positive cardiomyocytes (bar scale = 50 μm). E. Fluorescence signal due to in situ hybridization of viral RNA observed in each slide was quantitatively estimated using Image J software (Software free NIH) three times at two magnifications (X20 and X40). Briefly, thresholding techniques were successively performed to remove background noise and empty spaces and to select relevant fluorescent cytoplasmic foci due to in situ hybridization. Results were expressed as fluorescent pixels per 100,000. ***: P<0.001 by Mann Whitney U test.

