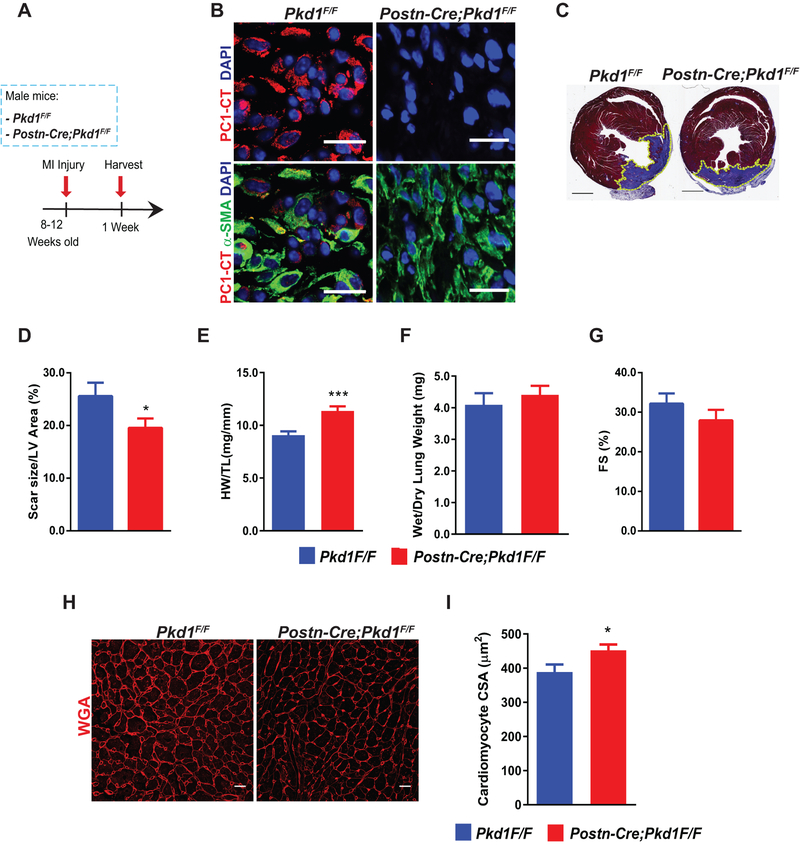
Figure 6. Fibroblast-specific PC1 inactivation enhances pathological cardiac remodeling following myocardial infarction (MI).
(A) MI surgery was performed in 8–12 week-old male mice of the following genotypes: Pkd1F/F and Postn-Cre; Pkd1F/F. Hearts were harvested 1 week post-surgery. (B) Immunofluorescence from the scar zone to evaluate PC1 down-regulation in activated fibroblasts with PC1 C-terminal antibody (PC1-CT) and α-SMA as a marker of activated fibroblasts (scale bar: 20 μm). Nuclei were stained with DAPI (100 μg/mL), and images representative of 4 animals per group are depicted. Images were obtained using a confocal microscope. (C) Masson trichrome staining was performed to evaluate fibrosis and scar size. Representative images (n=12 animals per group) were obtained using a slide scanner (scale bar: 1 mm). (D) Scar size quantification. Data are shown as mean ± S.E.M., unpaired Student’s t-test with Welch’s correction, n=12 animals per group. *p < 0.05. Morphometric analyses were performed after MI. (E) Heart weight/tibia length (HW/TL) and (F) wet/dry lung weight. Data are shown as mean ± S.E.M., unpaired Student’s t-test with Welch’s correction, n=19–21 animals per group. ***p < 0.001. (G) Ventricular contractile function was evaluated by transthoracic echocardiography. Fractional shortening (FS). Data are shown as mean ± S.E.M., unpaired Student’s t-test with Welch’s correction, n=19–22 animals per group. *p < 0.05. (H and I) Evaluation of cardiomyocyte cross-sectional area (CSA) after MI by wheat germ agglutinin (WGA) staining. (H) Representative images of WGA staining. Images were obtained with a confocal microscope (scale bar 20 μm). (I) Quantification of data depicted in (H). Data are shown as mean ± S.E.M., unpaired Student’s t-test with Welch’s correction, n=10–11 animals per group. *p < 0.05.

