8.

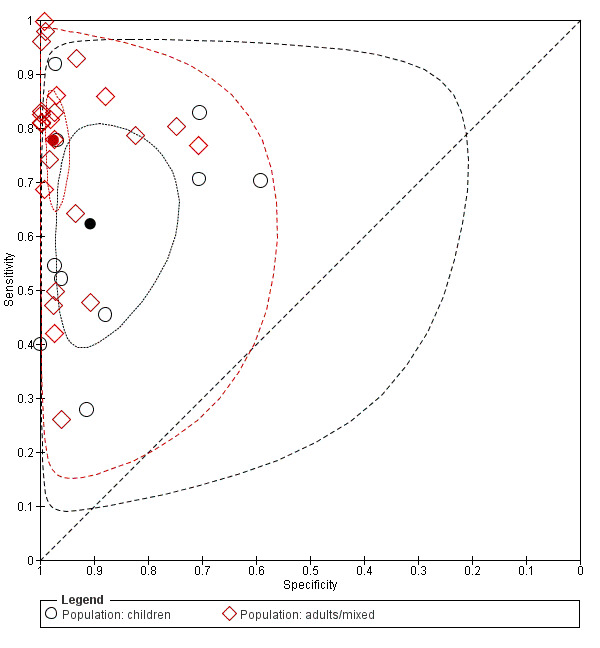
Summary receiver operating characteristic (ROC) plot of sensitivity and specificity: paediatric studies (n = 10; indicated in black) versus non‐paediatric studies (n = 24; indicated in red). The solid circles represent the summary estimates of sensitivity and specificity. The summary estimates are surrounded by a dotted line representing the 95% confidence region and a dashed lined representing the 95% prediction region.
