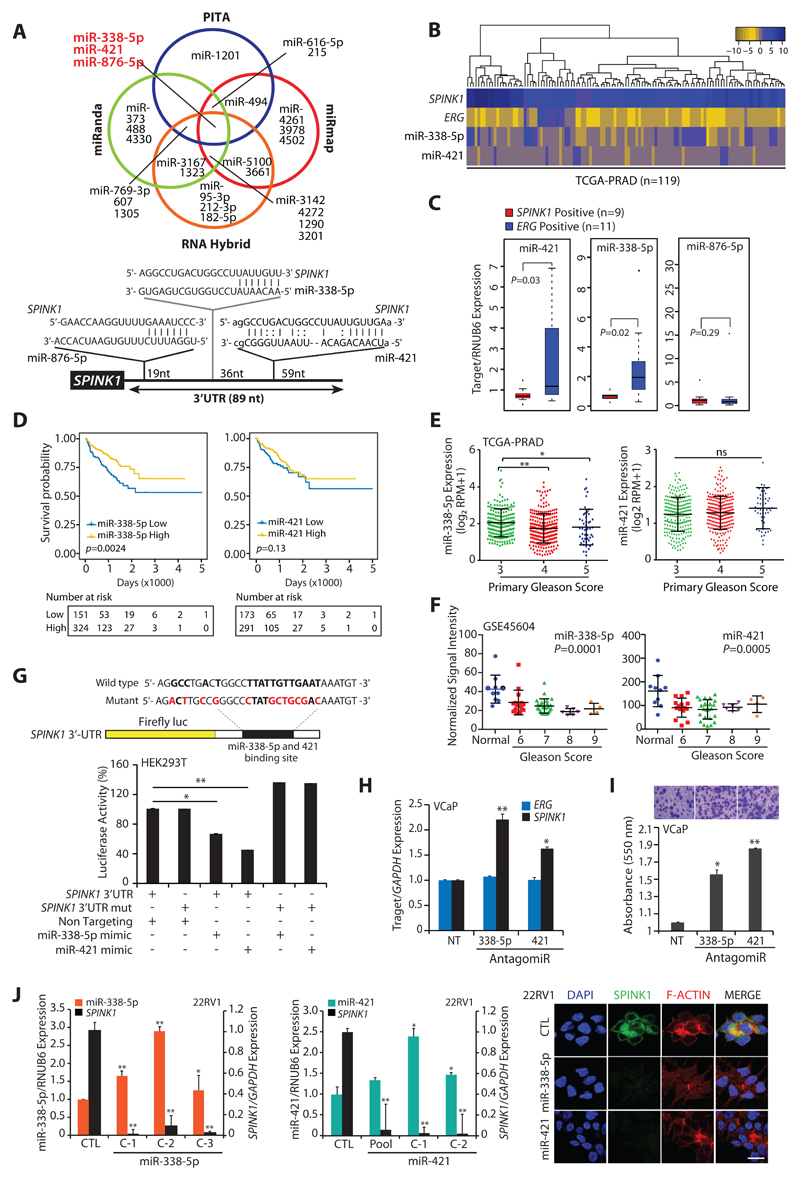
Figure 1. MiR-338-5p and miR-421 are differentially expressed in SPINK1+/ERG-fusion-negative prostate cancer.
(A) Venn diagram displaying miRNAs computationally predicted to target SPINK1 by PITA, miRmap, miRanda and RNAHybrid (top panel). Schematic of predicted miR-338-5p, miR-421 and miR-876-5p binding sites on the 3′-UTR of SPINK1 (bottom panel).
(B) Heatmap depicting miR-338-5p and miR-421 expression in the SPINK1+/ERG-negative patients’ (n=119) in TCGA-PRAD dataset. Shades of blue and golden represents log2 (x+1), where x represents the gene expression value.
(C) Taqman assay showing relative expression for miR-338-5p, miR-421 and miR-876-5p in SPINK1+ and ERG+ PCa patients’ specimens (n=20). Data represents normalized expression values with respect to RNUB6 control. Error bars represent mean ± SEM. P-values were calculated using two-tailed unpaired Student's t test.
(D) Kaplan-Meier curve showing survival probability in TCGA-PRAD cohort stratified based on high versus low miR-338-5p and miR-421expression (n=475 and n=465 respectively).
(E) RNA-Seq data from TCGA-PRAD cohort showing expression of miR-338-5p (n=475) and miR-421 (n=465) in PCa patients categorized by varying primary Gleason Score.
(F) Expression of miR-338-5p and miR-421 in PCa patients (normal=10, PCa =50) categorized by Gleason grades (from GSE45604 dataset).
(G) Schematic of luciferase reporter construct with the wild-type or mutated (altered residues in red) SPINK1 3’ untranslated region (3’UTR) downstream of the Firefly luciferase reporter gene (top panel). Luciferase reporter activity in HEK293T cells co-transfected with wild-type or mutant 3′-UTR SPINK1 constructs with mimics for miR-338-5p or miR-421.
(H) QPCR data showing SPINK1 and ERG expression in VCaP cells transfected with antagomiRs as indicated (n=3 biologically independent samples; data represent mean ± SEM).
(I) Boyden chamber Matrigel invasion assay using same cells as in (E). Representative fields of the invaded cells are shown in the inset.
(J) QPCR analysis demonstrating SPINK1 and miRNAs expression in stable 22RV1-miR-338-5p (left panel) and 22RV1-miR-421 cells (middle panel) (n=3 biologically independent samples; data represent mean ± SEM). Immunostaining for SPINK1 (right panel). Scale bar represents 20µm.
Statistical significance was calculated by one-way ANOVA with Tukey’s post hoc test for multiple comparisons in the pane E and F. For all other panels *P ≤ 0.05 and **P ≤ 0.005 using two-tailed unpaired Student's t test.

