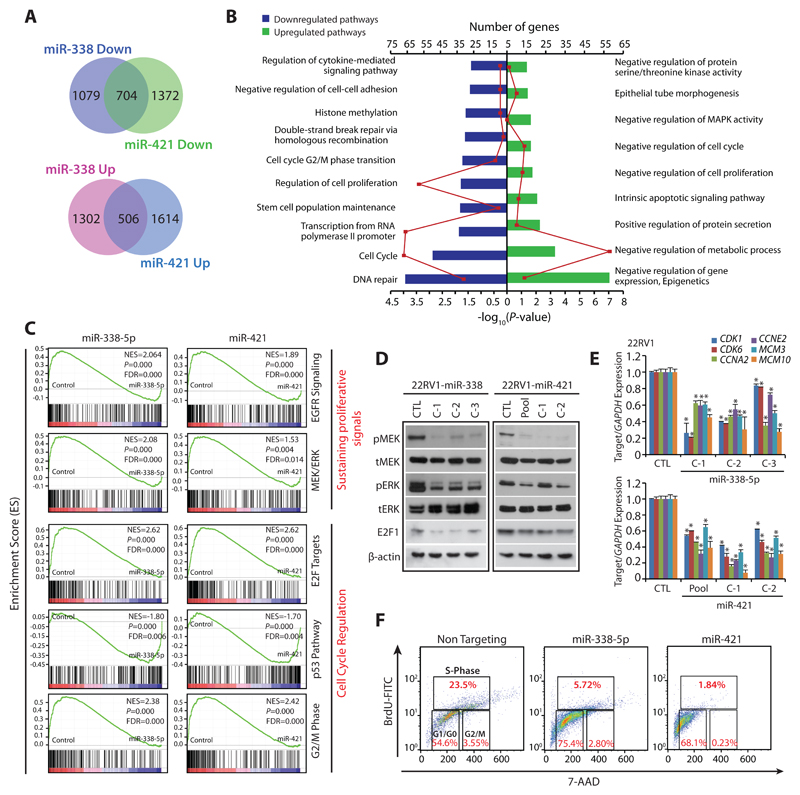
Figure 3. MiR-338-5p and miR-421 overexpression suppress oncogenic pathways and triggers G1/S arrest.
(A) Gene expression profiling data showing overlap of downregulated (upper panel) and upregulated genes (lower panel) in stable 22RV1-miR-338-5p and 22RV1-miR-421 cells relative to 22RV1-CTL cells (n=3 biologically independent samples).
(B) Same as in (A), except DAVID analysis showing various downregulated (left) and upregulated (right) pathways. Bars represent –log10 (P-values) and frequency polygon (line in red) represents the number of genes.
(C) Gene Set Enrichment Analysis (GSEA) plots showing various deregulated oncogenic gene signatures with the corresponding statistical metrics in the same cells as in (A).
(D) Western blot analysis for phosphor (p) and total (t) MEK1/2, ERK1/2 and cell-cycle regulator E2F1 levels. β-actin was used as a loading control.
(E) QPCR analysis showing expression of cell-cycle regulators for G1 and S phase as indicated. Expression level for each gene was normalized to GAPDH.
(F) BrdU/7-AAD cell-cycle analysis for S-phase arrest in 22RV1 cells transfected with miR-338-5p or miR-421 mimics relative to control cells.
In the panels (D), (E) and (F) biologically independent samples were used (n=3); data represents mean ± SEM *P≤ 0.05 and **P≤ 0.005 using two-tailed unpaired Student's t test.

