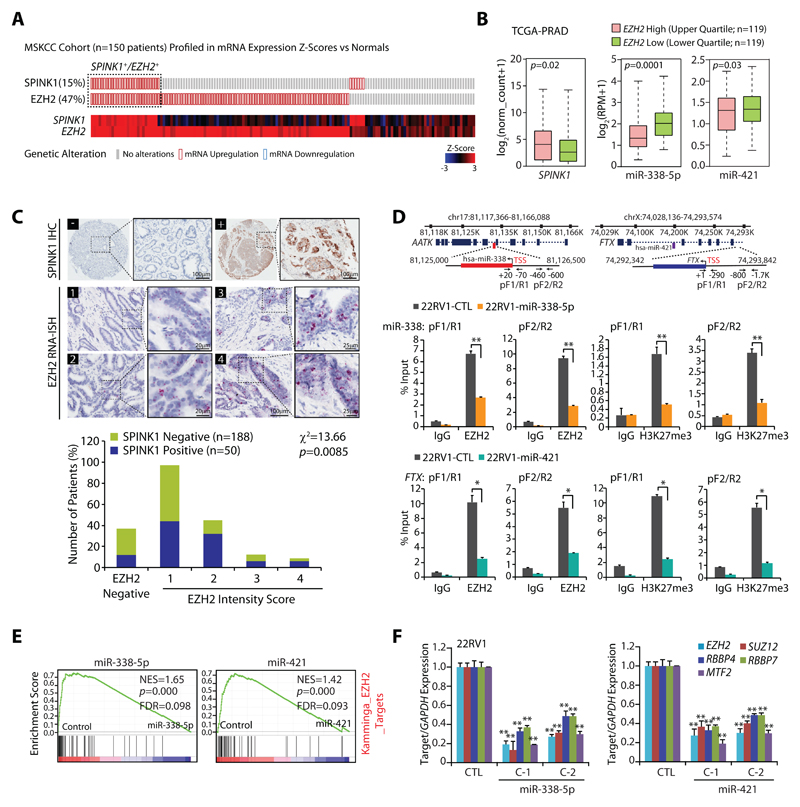
Figure 5. Epigenetic silencing of miR-338-5p and miR-421 via EZH2 in SPINK1 positive prostate cancer.
(A) OncoPrint depicting mRNA upregulation of EZH2 and SPINK1 in MSKCC cohort using cBioportal. In the lower panel shades of blue and red represents Z-score normalized expression for EZH2 and SPINK1.
(B) Box plot depicting SPINK1, miR-338-5p and miR-421 expression in EZH2 high (n=119) and EZH2 low (n=119) in PCa patients from TCGA-PRAD cohort
(C) Representative micrographs depicting PCa tissue microarray (TMA) cores (n=238) stained for SPINK1 by immunohistochemistry (IHC) and EZH2 by RNA in-situ hybridization (RNA-ISH). Top panel represents SPINK1 IHC in SPINK1 negative (–) and SPINK1 positive (+) patients. RNA-ISH intensity score for EZH2 expression was assigned on a scale of 0 to 4 according to visual criteria for the presence of transcript at 40X magnification. Bar plot show EZH2 expression in the SPINK1-negative and SPINK1+ patient specimens. P-value for Chi-square test is indicated.
(D) Genomic location for EZH2 binding sites on the miR-338 and FTX promoters and location of ChIP primers (top panel). ChIP-qPCR data showing EZH2 occupancy and H3K27me3 marks on the miR-338, FTX promoters, and MYT1 used as positive control in stable 22RV1-miR-338-5p, 22RV1-miR-421 and 22RV1-CTL cells.
(E) GSEA plots showing the enrichment of EZH2 interacting partners (Kamminga) in 22RV1-miR-338-5p and 22RV1-miR-421 cells.
(F) QPCR data showing expression of EZH2 and its interacting partners in the same cells as indicated.
Biologically independent samples (n=3) were used in panels (D) and (F); data represent mean ± SEM. *P≤ 0.05 and **P≤ 0.005 using two-tailed unpaired Student's t test.

