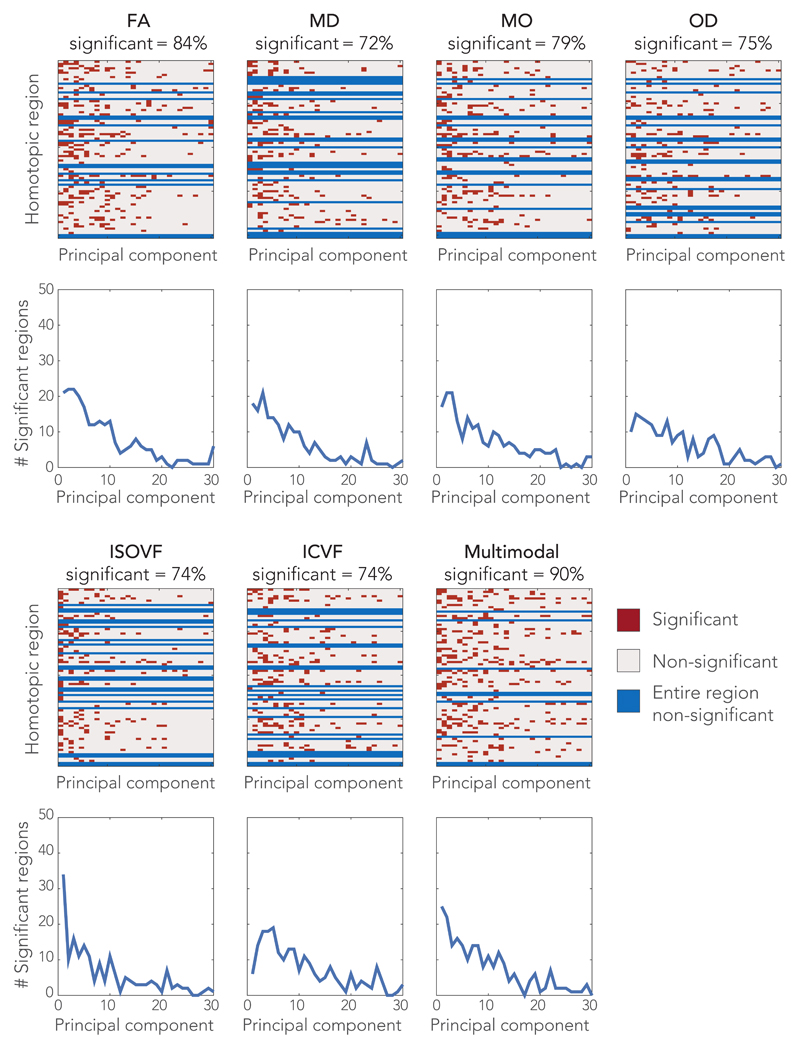
Figure 3.
Significant associations between functional connectivity and microstructure of the connecting white matter tract. Each row in the matrices represents a homotopic region pair with each entry a regressor (on the microstructural principal components) of the linear model. Significance of the regressors is color-coded. The graphs depict the number of regions for which a particular rank order principal component yielded a significant regressor (so for example, in the multimodal models, the first principle component was significant for 28 brain regions). The percentage of homotopic region pairs demonstrating at least one significant regressor is given in the label of each matrix. Statistical significance was determined using permutation testing (two-sided, n = 100,000 permutations, Puncorrected < 2.9 x10⁻⁶, Pcorrected < 0.05, corrected for multiple comparisons).

