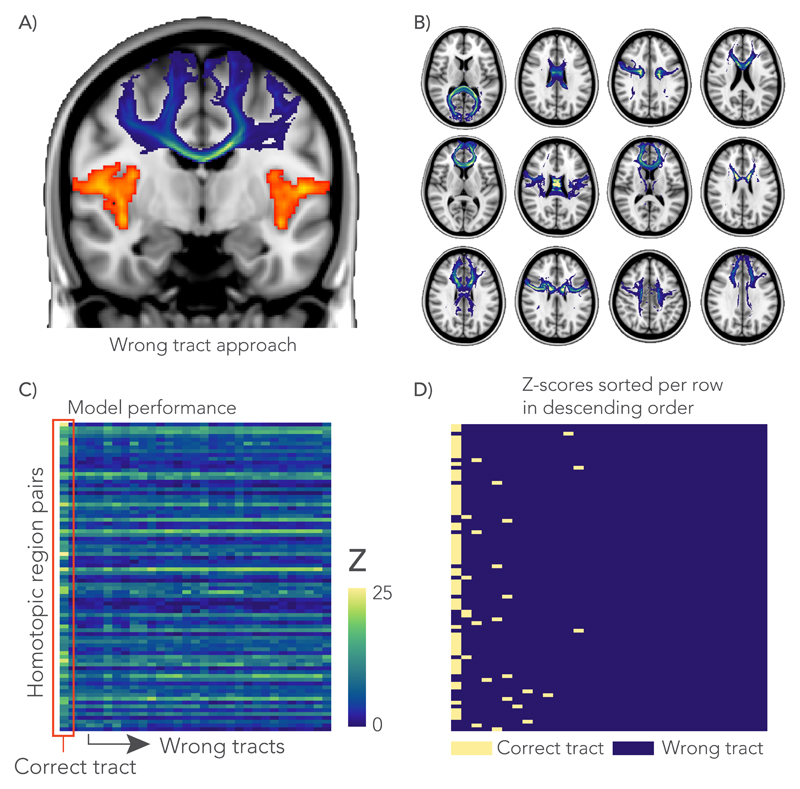
Figure 6.
Negative control analysis. A) In the wrong tract approach, the GLM-analysis was performed with a tract (shown in blue) that does not directly connect between a homotopic pair of interest (shown in orange). B) A total of 30 distinct tracts (12 shown here) were chosen based on minimal spatial overlap between them. C) For each GLM, an F-statistic (across the whole model, with the degrees of freedom for model and error, 30 and 7450, respectively) was calculated and transformed to a Z-score to compare between the correct tract and 30 wrong tracts. All GLMs in this analysis were derived from the multimodal microstructural information. D) Rows from the matrix in C were sorted in descending order of Z-score and labelled according to whether they represent the correct pathway or a different tract. The highest Z-scores (left-most column) correspond to the anatomically correct tract in 70% of cases, and overall the correct tract was in the top three models in 81% of cases.

