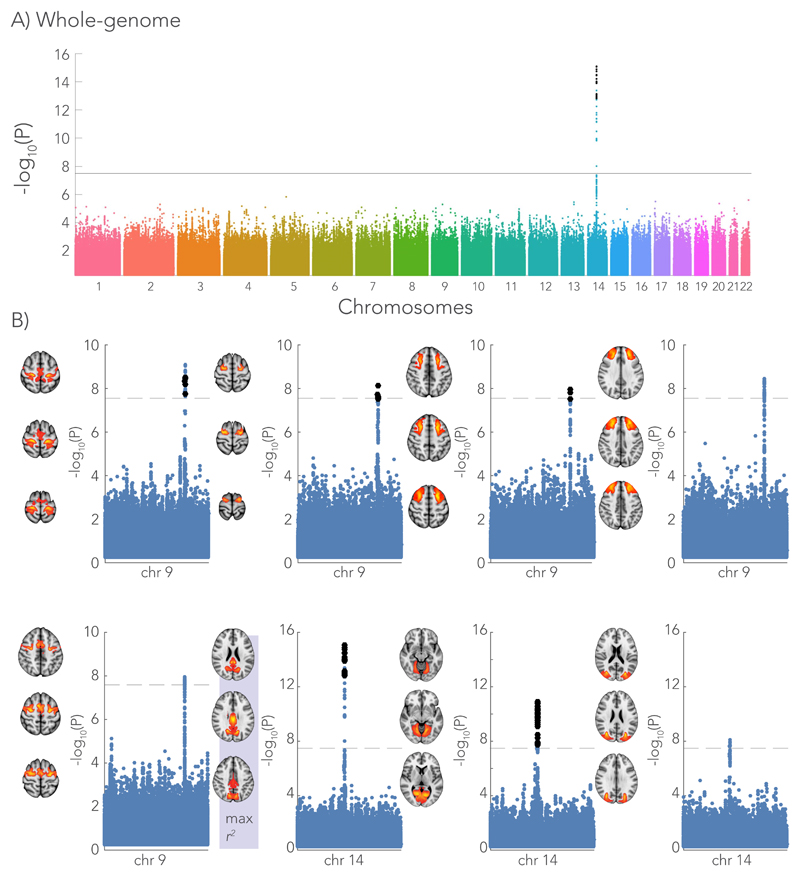
Figure 7.
Genome-wide associations with the microstructure-function phenotype (i.e. the pattern of functional connectivity that can be predicted from white matter microstructure). The Manhattan plot depicts the associations with each SNP across all chromosomes expressed as the -log10 p-value. A) As an example, the genome-wide Manhattan plot is given for the homotopic brain region showing the highest variance explained by the microstructure – function model (n = 7481 subjects). The strongest association is with a SNP (rs74826997) in chromosome 14 (linear regression, two-sided). B) Single chromosome Manhattan plots are shown for brain regions that associate with SNPs in either chromosome 9 or 14 that co-located with the genes LPAR1 and DAAM1, respectively (linear regression, two-sided). The -log10 p-value of the SNPs in the discovery GWAS (7481 subjects) are depicted by the blue dots. In an additional cohort of 3873 subjects, we aimed to replicate the significant hits (black dots in single chromosome Manhattan plots). The ICA spatial maps of these brain areas are given for each of Manhattan plot. The brain area (posterior cingulate cortex) highlighted with max r2 corresponds to the genome-wide Manhattan plot in (A). A significance threshold is given for a -log10(p-value) equal to 7.5 corresponding to a p-value of ~3 x 10⁻⁸. Significance threshold for the replication GWAS was determined using Bonferroni correction (p < 1.47x10⁻⁴).

