
Figure 1.
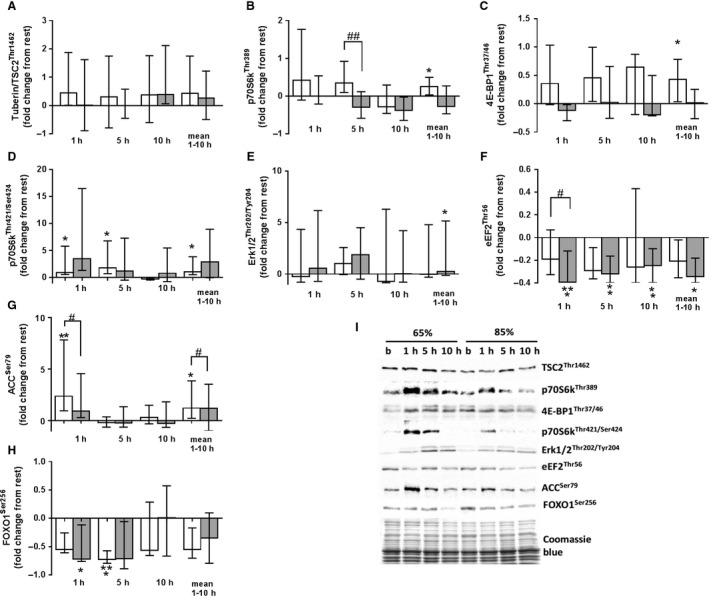
Fold changes (from rest) in expression of phosphorylated TSC2Thr1462 (a), p70S6kThr389 (b), 4EBP1Thr37/46 (c), p70S6kThr421/Ser424 (d), ERK1/2Thr202/Tyr204 (e), eEF2Thr56 (f), ACCSer79 (g), and FOXO1Ser259 (h) in skeletal muscle at 1, 5, and 10 h after high load (shaded column; 85% 1RM) and moderate load exercise (white column; 65% 1RM). Representative immunoblots of the above are shown in (i). Data represent the median and interquartile range. * denotes a significant difference from pre‐exercise levels (*P < 0.05, **P < 0.01, ***P < 0.001). # denotes a significant effect of exercise load (# P < 0.05, ## P < 0.01).