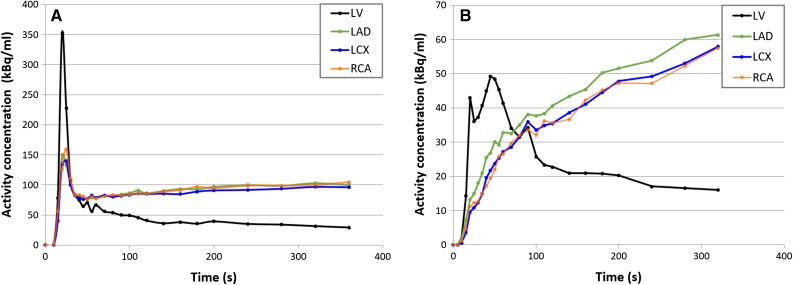
Figure 1.
Linegraph showing (A) normal time activity curves (TACs) with a high peak value for the left ventricle (LV) during the first-pass phase and where the vascular territories (LAD, LCX and RCA) gradually reach a steady state and (B) unreliable TACs with no clear LV peak and lack of steady state for the three vascular territories

