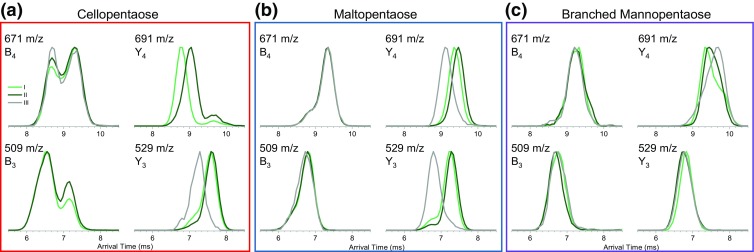
Figure 5.

IMS/IMS spectra of selected product ions of (a) cellopentaose, (b) maltopentaose, and (c) branched mannopentaose. Panel colors correspond to traces in Figure 3. Product ions originating from components I, II, and III are represented by light green, dark green, and gray traces, respectively. The 509 and 691 m/z product data for cellopentaose from component III (low level) and IMS/IMS spectra of other product ions and the remaining precursor ions are presented in Figures S7–S9
