Figure 2.

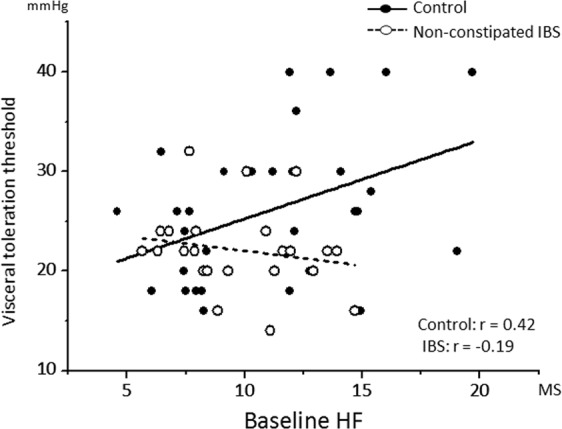
A scatter plot of the correlation between the baseline parasympathetic vagal tone (HF) and visceral perception threshold. Regression lines are shown per group. HF, high frequency; IBS, irritable bowel syndrome. MS, meter second.

A scatter plot of the correlation between the baseline parasympathetic vagal tone (HF) and visceral perception threshold. Regression lines are shown per group. HF, high frequency; IBS, irritable bowel syndrome. MS, meter second.