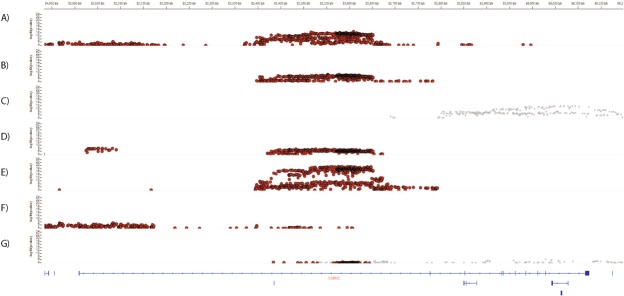
Figure 4.
IGV regional plot of associations of SNPs with expression levels of CADM2 in (A) subcutaneous adipose tissue, (B) visceral adipose tissue, (C) brain-cerebellum, (D) heart-left ventricle, (E) skeletal muscle, (F) lung and (G) tibial nerve. Position in base pairs is given on the X-axis (top) and in relation to the gene (bottom). The Y-axis gives the p value for the association in each tissue. Red indicates SNPs with significant associations with CADM2 (at FDR < 5%), Grey indicates SNPs with significant associations with CADM2-AS1 (at FDR < 5%).

