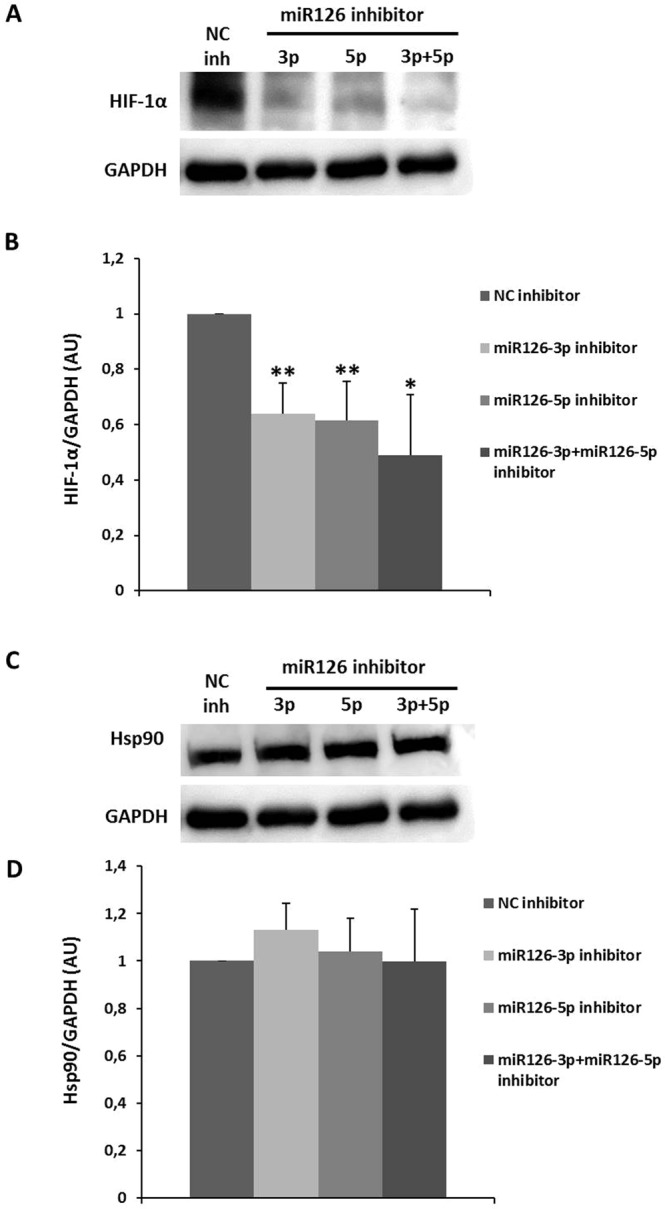
Figure 9.

Effect of miR-126 inhibition on HIF-1α and Hsp90 protein levels in early passage HUVECs. (A) Representative HIF-1α western blot in early passage HUVECs transfected with negative control (NC) inhibitor, miR-126-3p strand, miR-126-5p strand or both sequence inhibitors, miR-126-3p plus miR-126-5p for 72 hours. Equal protein loading was confirmed probing with GAPDH. (B) The graphs present densitometric band analysis normalized to GAPDH in arbitrary units (AU). The data represent means ± SD. n = 3.Control vs. miR-126-transfected early passage HUVECs cells. *p < 0.05 and **p < 0.01. (C) Representative Hsp90 western blot in early passage HUVECs transfected with negative control (NC) inhibitor, miR-126-3p strand, miR-126-5p strand or both sequence inhibitors, miR-126-3p plus miR-126-5p for 72 hours. Equal protein loading was confirmed probing with GAPDH. (D) The graphs present densitometric band analysis normalized to GAPDH in arbitrary units (AU). The data represent means ± SD. n = 3.
