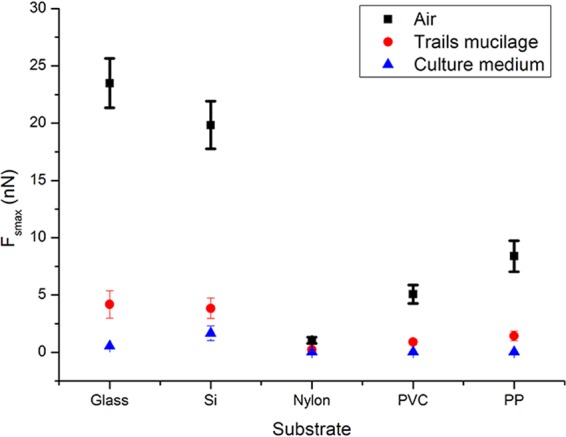
Figure 8.

Comparison of the maximum adhesive force Fsmax between cantilever tip and different substrates in different mediums. The black squares represent Fsmax measured on clean substrates in the air. The red circles represent Fsmax measured in mucilage trails on substrates in culture medium. The blue triangles represent Fsmax measured on clean substrates in culture media. Error bars represent one standard deviation of calculation for 40 separate force curves (4 samples for each kind of material and 10 separate force curves for every sample).
