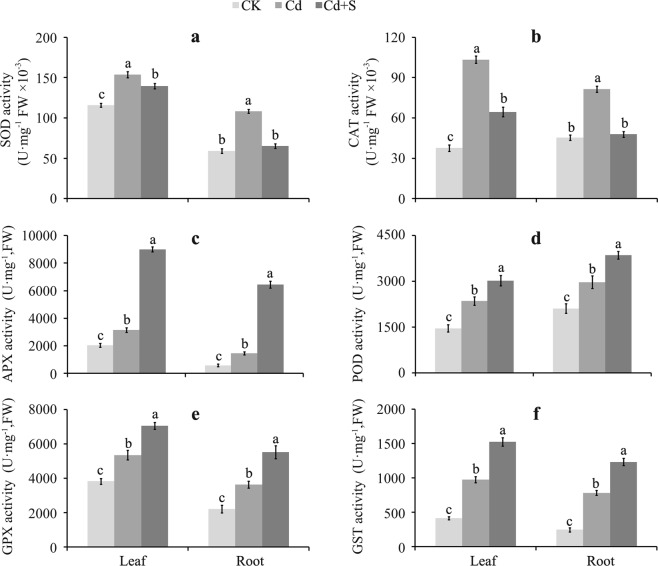
Figure 3.
The variation of antioxidant enzyme activities in the leaf and root of tartary buckwheat exposed to Cd in the presence of surplus S. (a–f) Represent the change pattern of SOD, CAT, APX, POD, GPX, and GST activity, respectively. Bars with different letters show the significant difference within each group at p < 0.05 (n = 3) according to Duncan’s multiple test. CK: control plants without Cd or surplus S treatment; Cd: plants treated with cadmium; Cd + S: plants treated with cadmium and surplus sulfur.

