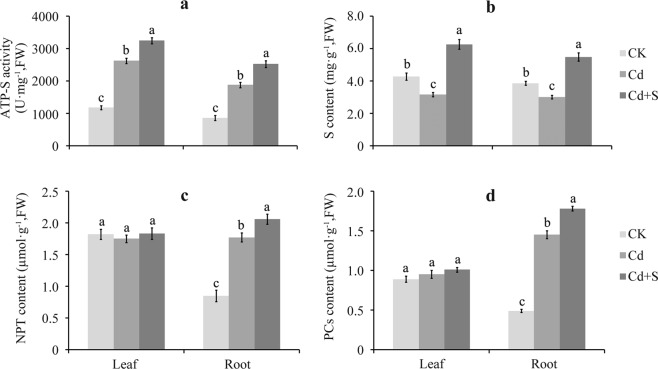
Figure 5.
Effect of surplus S on ATP-S activity, S content, and thiol group containing peptides content in the leaf and root of tartary buckwheat. (a–d) Represent the change pattern of ATP-S activity, S content, NPT content and PCs content, respectively. Bars with different letters show the significant difference within each group at p < 0.05 (n = 3) according to Duncan’s multiple test. CK: control plants without Cd or surplus S treatment; Cd: plants treated with cadmium; Cd + S: plants treated with cadmium and surplus sulfur.

