Figure 1.
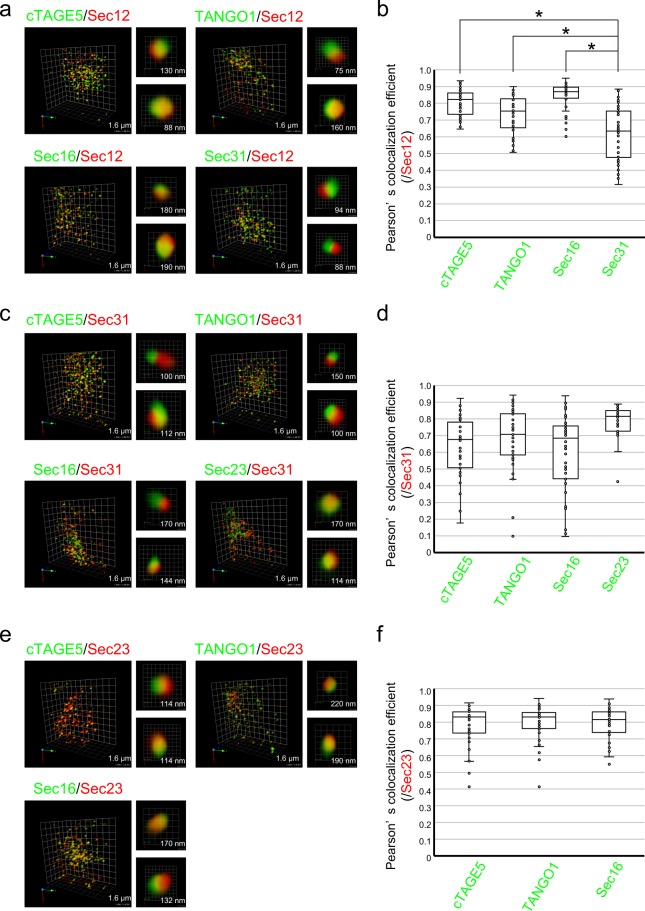
COPII components show distinct localization within each ER exit site. (a) HeLa cells were fixed and costained with anti-cTAGE5 (green) or anti-TANGO1 (green) or anti-Sec16 (green) or anti-Sec31 (green) and anti-Sec12 (red) antibodies. 3D dual-color observation by SCLIM is shown. Right, magnifications of images on the left with two-dimensional (2D) projection. The length indicates the scale of each unit. (b) Quantification of Pearson’s correlation coefficient to quantify the degree of colocalization in (a). n = 40 (eight ER exit sites in 5 cells). (c) HeLa cells were fixed and costained with anti-cTAGE5 (green) or anti-TANGO1 (green) or anti-Sec16 (green) or anti-Sec23 (green) and anti-Sec31 (red) antibodies. 3D dual-color observation by SCLIM is shown. Right, magnifications of images on the left with 2D projection. The length indicates the scale of each unit. (d) Quantification of Pearson’s correlation coefficient to quantify the degree of colocalization in (c). n = 40 (eight ER exit sites in 5 cells). (e) HeLa cells were fixed and co-stained with anti-cTAGE5 (green) or anti-TANGO1 (green) or anti-Sec16 (green) and anti-Sec23 (red) antibodies. 3D dual color observation by SCLIM is shown. Right, magnifications of images on the left with 2D projection. The length indicates the scale of each unit. (f) Quantification of Pearson’s correlation coefficient to quantify the degree of colocalization in. (e) n = 40 (eight ER exit sites in 5 cells). Results in (b,d,f) are displayed as box-and-whisker plots (whiskers represent 1.5× interquartile range) *P < 0.05.

