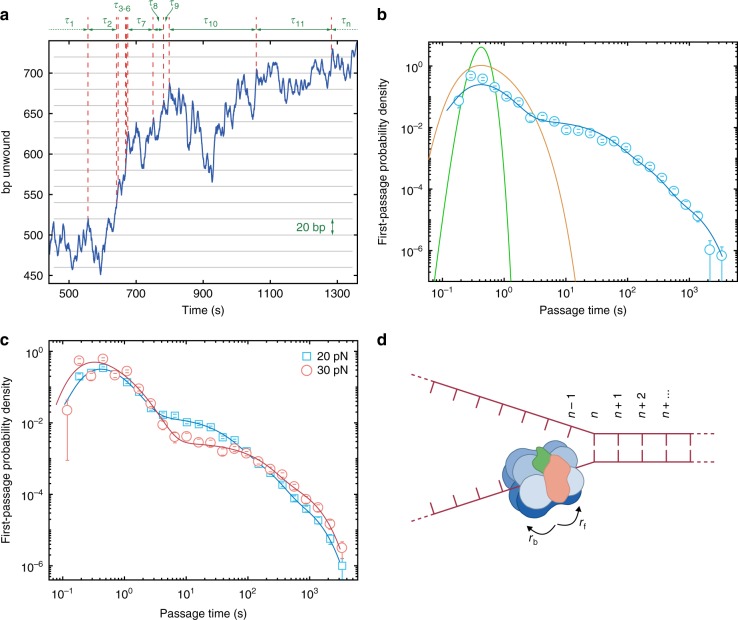
Fig. 3.
Extracting dynamic and kinetic information from CMG unwinding trajectories. a Portion of an example unwinding trajectory. Complex motion is observed but assigning any portion to a given state of unwinding, annealing, or pausing, leads to miscounting and is biased. Instead we measure the time taken, τ, for the helicase to first unwind a set interval of basepairs (grey horizontal lines) along the whole trajectory, to give a list of first-passage times. τ3–6, for example, are short due to the fast unwinding present, τ10 is long due to re-unwinding of the same DNA and τ11 is long due to a crudely described pause. b Experimental first-passage time distribution for 4 mM ATP and 20 pN force (blue circles); bins are normalised by bin width and total counts. Blue line is maximum likelihood estimation for the model of Eq 2. Note, the data is not directly fit to the experimental histogram, MLE estimates the parameters best suited to describe the distribution of all first-passage times. Data from 21 molecules and 1009 first-passage times. Green line is the analytical first-passage time distribution solution for a unidirectional mechanism that includes the stochastic nature of biochemical processes, a gamma function, parameterised by the number of steps to cross the passage interval and the rate of unwinding. A biased random walk provides a broader peak, calculated with the same modal FPT, and is parameterised by the rate of forward and backwards hopping (orange line, first term Eq. 2). c Comparison of two FPT distributions at different forces and constant 4 mM ATP concentration. Blue squares are at 20 pN with a resulting model fit (blue line) which includes 3 pause states. Red circles are 30 pN with a resulting model fit (red line) which includes 2 pause states. Data is as reported in Supplementary Table 1. d The helicase is treated as translocating along ssDNA at the ss-dsDNA fork junction by hopping discretely in space, but continuously in time, forward or backwards one base pair at a time with rates rf and rb respectively. All error bars are standard deviation from 1000 bootstraps

